
Jump to
1. Introduction
The Australian Government released the first Intergenerational Report (IGR) in 2002 and the second IGR in 2007, highlighting how labour shortages combined with growing demand for health care for an ageing population have the potential to place the Australian Government budget balance in an unsustainable position (Commonwealth of Australia, 2007; Schofield and Rothman, 2006; Commonwealth of Australia, 2002). According to the former Treasurer, “the whole economic agenda of the government at the moment is drawn from the IGR” (Davis, 2006) and “in practically every portfolio area – health, education, family benefits, welfare, superannuation, pensions – the IGR now provides the overall architecture within which we operate” (Costello, 2005).
The previous Prime Minister and Treasurer have both noted that keeping older people working longer is necessary to Australia’s financial future (Costello, 2005; Howard, 2003). Indeed, the previous government responded by providing a number of economic incentives to encourage older workers to remain in the labour force until at least the age of 60 years. For example, the government removed the 15 per cent tax on superannuation schemes if retirement is delayed until the age of 60 years (Australian Government, 2006; Australian Bureau of Statistics, 1998), and changed the superannuation rules to allow workers to continue to work while drawing on a superannuation pension from 1 July 2005 (Australian Government, 2004).
However, the potential impact of these incentives is limited by the large proportion of older workers who retire due to illness rather than for financial reasons. About half of men and one quarter of women who retire from full time work between the ages of 45 and 55 years do so because of their own ill health (Australian Bureau of Statistics, 1998). As ill health is a major constraint on older workers’ labour force participation, these economic incentives may not increase the future supply of older labour as substantially as it otherwise could have. Accordingly, measures to reduce ill health amongst older workers may be just as important in preventing labour shortages as economic measures.
There has been mixed evidence in Australia in terms of improvements in health and disability with wide variation depending on the measures used and the conditions considered. For example, there have been falls in the prevalence of some health conditions in Australia (such as hospital admissions for coronary heart disease) but a rise in others (such as the prevalence of diabetes) (Australian Institute of Health and Welfare, 2006; Australian Institute of Health and Welfare, 2001). Similarly, there has been a fall in the prevalence of some health risk factors (such as smoking) and a rise in others (such as obesity). There has been mixed evidence about trends in disability. The Australian Institute of Health and Welfare (AIHW) reported rising age adjusted national rates of disability between 1981 and 1998 (Australian Institute of Health and Welfare, 2001). However, the AIHW later concluded that rising age adjusted rates of disability observed over this period were due to changes in the Australian Bureau of Statistics Disability, Ageing and Carers Surveys. Nonetheless, it was concluded that there had not been a fall in age adjusted rates of disability (Australian Institute of Health and Welfare, 2003). The Productivity Commission reviewed the evidence of better health among older people and concluded that there was not evidence of sufficient improvements offsetting emerging chronic diseases to reduce health expenditure in Australia (Productivity Commission, 2005).
A number of international papers have reported trend declines in disability rates, particularly in the United States, although these have tended to have been for persons beyond traditional retirement age (Crimmins et al., 1997; Manton et al., 1997). While studies have generally reported a declining trend in disability rates among the older population, some studies have reported an increasing trend among the young and working age population of less than 60 years old (Bhattacharya et al., 2008; Lakdawalla et al., 2004). There has also been a reported increase in the number of people receiving sickness benefits in the United Kingdom suggesting that disability rates are increasing in the working age population (Moncrieff and Pomerleau, 2000). Further, recent projections by Sturm et al (2004) concluded that if current trends in obesity continue in the United States then disability will increase by one per cent per year more in the 50–69 age group than if there were no further weight gain (Sturm et al., 2004).
Several studies have demonstrated that chronic conditions are associated with early retirement (Zhang et al., 2009; Schofield et al., 2008; Lixin and Kalb, 2004). However, there has been little work done to analyse what impact this association will have on the future work force given the ageing population and the increasing trend of most of the chronic conditions. In this paper, we examine the following question: “Will the older working age population be healthier such that they are able to work longer to support their extended retirement in future”? Health&WealthMOD, the first Australian microsimulation model of health, income, tax, transfer payments and wealth for persons aged 45 to 64 years is used to simulate the impacts of health trends on labour force participation and to project the long term impacts of health on the labour market by estimating the number of workers missing from the labour market due to ill health over the next 20 years.
The main aim of Health&WealthMOD microsimulation model is to estimate the economic impacts of chronic conditions on older workers, aged 45 to 65 years. It is a static microsimulation model based on cross-sectional survey data. The model estimates the number of persons taking early retirement due to chronic health conditions and its follow-on economic impacts such as the individuals’ potential lost earnings and savings and the costs to the Australian Government through lost taxation revenue and additional government pension and benefit payments. The model can also estimate the potential personal and Government financial gains that would accrue with intervention that might treat or prevent particular conditions and the potential impact of reduced illness in the older working age population. However, the focus of this paper is to demonstrate an application of Health&WealthMOD to measure the impact of health on projected labour force participation.
2. Methods
Health&WealthMOD used the confidentialised unit record file (CURF) of the 2003 Survey of Disability, Ageing and Carers conducted by the Australian Bureau of Statistics (ABS) as the base population (Australian Bureau of Statistics, 2004). The survey collected data from a sample of 13,996 private dwellings, 272 non-private dwellings and 554 institutions such as hospitals and aged care residences, collecting information on 36,088 persons residing in private and nonprivate dwellings and 5,145 persons residing in institutions. The records of people aged 45 to 64 years were analysed to identify the conditions that were more likely to keep people out of the labour force. Labour force participation was defined as being either employed or looking for work. People who were neither employed nor looking for work were identified as “out of labour force”.
Chronic health conditions were reported in the survey according to the ABS classification of chronic health conditions which were based on International Classification of Diseases, Version 10 (ICD-10) codes. The ABS classifications were further grouped into broader classifications for this analysis. Survey participants reported the condition which caused them the most problems as their main condition in the survey. Data analysis was undertaken only for the self reported main conditions.
Odds ratios of being out of the labour force associated with each chronic condition were estimated, with “no condition” as a reference group, using logistic regression analysis. Odds ratios were estimated separately for males and females and were adjusted for age. Data were weighted by the ABS to provide an estimate of the total number of persons in the Australian population with similar demographic characteristics with respect to age, sex, state/territory and section of state. The analysis adjusted for unequal weighting for individuals in the survey.
The attributable risks (AR%) of being out of the labour force associated with each chronic condition were estimated as the proportion of people not in the labour force among those with the condition that was in excess of people with no condition. The odds ratios (OR) were used as approximated relative risks for the calculation of AR% and the formula was AR% = (OR−1)/ OR x 100%. All chronic conditions except noise induced deafness/hearing loss and endocrine/nutritional and metabolic disorders other than diabetes were found to be associated with being out of the labour force. The method and results were explained in detail elsewhere (Schofield et al., 2008).
Based on the three Surveys of Disability, Ageing and Carers (1993, 1998 and 2003), age sex standardised prevalence rates of each of the chronic conditions were estimated for the years 1993, 1998 and 2003 for 45 to 64 years age group population using the 2003 population as the standard population. Assuming linear growth in the age sex standardised prevalence rates, trends in each chronic condition were calculated to determine whether there was a significant increase or decrease over the 10 year period from the 1993 survey to the survey conducted in 2003, with the exception of dorsopathies (back conditions) which was calculated over the period 1998 to 2003 as changes in definitions meant that the series was not continuous. The growth rate over the 10 year period for different conditions varied between an annual growth rate of 12.3% for diseases of the nervous system and −3.4% for diseases of the eye and adnexa. Age sex standardised prevalence rates and the annual growth rate in prevalence rates of each chronic condition between 1993 and 2003 are presented in the Appendix.
The age sex standardised rates of disease in 2003 were combined with ABS population projections (grouped in the same sex and 5 year age groups) to establish the base number of people suffering chronic health conditions to 2020.
To project the number of people missing from the labour market due to a health condition over the next 20 years, the attributable risks of being out of the labour force for each condition in 2003 were applied to the projected number of people with chronic disease, the assumption being that presence of disease will have the same impact on labour force participation in the future as it does now. The mathematical formula used was:
Age-sex specific projected number of people missing from the labour market due to a health condition in year t
= Pop × PrevD2003 × (1+(AnnGrowthRate*(t-2003))) × NILF2003 × AR2003
where 2003 ≤ t ≥ 2020;
Pop is the ABS age-sex specific resident population projection for year t (Series B); PrevD2003 is the age-sex specific prevalence of each health condition in 2003; AnnGrowthRate is the annual growth rate between 1993 and 2003 in the age-sex standardised prevalence rate of each health condition;
NILF2003 is the age-sex specific proportion of people not in the labour force in 2003 for each health condition; and AR2003 is the sex-specific attributable risk of being out of the labour force associated with each condition.
Sensitivity analysis was undertaken to determine the impact of trend changes in the rate of illness at 0.5 and 1.5 times the trend growth rate and the impact of ABS low and high population growth projections. The base projection series used the medium growth Series B, which assumes medium population growth resulting from medium migration, life expectancy and fertility. Series A assumes higher population growth as a result of higher migration, life expectancy and fertility and Series C assumes lower population growth and has the same life expectancy and fertility assumptions as series B but lower migration (Australian Bureau of Statistics, 2005).
This approach is somewhat similar to that used in cost of illness studies in Australia (Access Economics, 2006; Access Economics, 2005a; Access Economics, 2005b) and internationally (World Health Organisation, 2005; Begley et al., 2001; Henriksson and Jonsson, 1998; Moore et al., 1997). The cost of illness studies typically assumed all persons with a specific condition would, without illness, have achieved average labour force participation for men and women aged 40 to 65 years. In this study, we have assumed that without the chronic condition, persons might have achieved the labour force participation of their 5-year age and sex cohort. This is important to distinguish between the effects of conditions that primarily impact on the oldest workers, (such as heart disease) and those which have a high prevalence among the younger age groups with generally higher employment rates (such as mental illness).
Data analysis was undertaken using SAS version 9.1 (SAS Institute, Cary, NC, USA). All statistical tests were conducted at a 5% level of significance.
3. Results
3.1 Population Projections
As the population ages, there is projected to be an increase in the proportion of the working aged population aged 15 to 64 years who are in the 45 to 64 year age group in Australia. The rise is expected to be most rapid between 2003 and 2010 with a 5 percentage point rise from 35% to 40% and a slower rise in the twenty years to 2040 to 42%. As this age group form an increasing proportion of the workforce, the importance of drivers of non-labour force participation for this age group increases.
| Sex | Age group | 2003 | 2010 | 2020 | 2030 | 2040 |
|---|---|---|---|---|---|---|
| Females | 45–49 | 11% | 11% | 11% | 11% | 11% |
| 50–54 | 10% | 10% | 10% | 10% | 11% | |
| 55–59 | 9% | 9% | 10% | 11% | 11% | |
| 60–64 | 6% | 9% | 10% | 10% | 10% | |
| Males | 45–49 | 10% | 11% | 10% | 11% | 11% |
| 50–54 | 10% | 10% | 10% | 10% | 11% | |
| 55–59 | 9% | 9% | 10% | 10% | 10% | |
| 60–64 | 7% | 9% | 9% | 10% | 10% | |
| Total persons | 45–64 | 35% | 39% | 40% | 41% | 42% |
Source: ABS population projections (Australian Bureau of Statistics, 2005)
3.2 Distribution within the base population
Out of 41,233 persons surveyed, 9,198 (22.3%) were in the age group 45 to 64 years. Among them, 49.3% (4,538) were male and the remaining 50.7% (4,660) were female. About 67.3% (6,188) of the population aged 45 to 64 years were in the labour force and the remaining 32.7% (3,010) were out of the labour force. Of the 3,010 persons not in the labour force, 54% (1,637) of non-participation was due to reasons other than their chronic conditions. Older age groups were less likely to be working than the younger population and women were less likely to be working than men.
3.3 Projections of people with chronic conditions
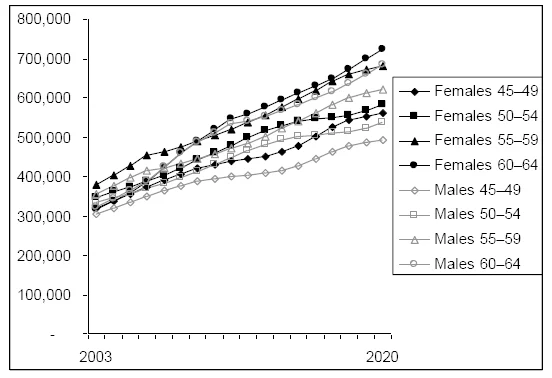
Just over half (57%) of Australians aged 45–64 were suffering chronic health conditions in 2003. This amounted to 2,682,623 individuals, 49% of whom were male (Table 2). The proportion of the population with chronic conditions was projected to grow by 10 percentage points by 2010 and by a further 6 percentage points in the following 5 years. By 2020, 80% of the 45–64 age group are projected to be experiencing some form of chronic illness (Table 3). Much of this increase is due to the rapid growth of the 60–64 age cohort combined with the high and increasing prevalence of disease in this group (Figure 1). The number of people experiencing chronic disease is projected to rise by approximately 120% in this oldest group compared to 68% among the 45–49 year olds. By 2020, 4,880,233 older working age Australians are expected to have chronic conditions, an 82% increase on 2003 figures. This is an increase from 20% to 32% of the working aged population aged 15–64 years.
| 2003 | 2010 | 2015 | 2020 | ||
|---|---|---|---|---|---|
| Females | 45–49 | 320,282 | 430,361 | 477,372 | 561,247 |
| 50–54 | 346,969 | 459,330 | 539,280 | 583,131 | |
| 55–59 | 378,388 | 505,277 | 597,730 | 681,067 | |
| 60–64 | 316,535 | 518,663 | 611,101 | 721,683 | |
| Total | 1,362,174 | 1,913,632 | 2,225,484 | 2,547,128 | |
| Males | 45–49 | 305,861 | 395,265 | 427,639 | 491,147 |
| 50–54 | 335,623 | 429,556 | 501,052 | 536,411 | |
| 55–59 | 355,338 | 455,978 | 540,327 | 621,625 | |
| 60–64 | 323,627 | 510,775 | 581,872 | 683,922 | |
| Total | 1,320,450 | 1,791,575 | 2,050,891 | 2,333,105 | |
| Persons | 45–49 | 626,143 | 825,626 | 905,012 | 1,052,394 |
| 50–54 | 682,592 | 888,886 | 1,040,333 | 1,119,543 | |
| 55–59 | 733,726 | 961,256 | 1,138,058 | 1,302,692 | |
| 60–64 | 640,162 | 1,029,439 | 1,192,973 | 1,405,605 | |
| Total | 2,682,623 | 3,705,207 | 4,276,375 | 4,880,233 |
| 2003 | 2010 | 2015 | 2020 | ||
|---|---|---|---|---|---|
| Females | 45–49 | 45% | 55% | 63% | 70% |
| 50–54 | 53% | 63% | 69% | 76% | |
| 55–59 | 66% | 75% | 82% | 88% | |
| 60–64 | 74% | 84% | 92% | 99% | |
| Total | 58% | 68% | 76% | 83% | |
| Males | 45–49 | 44% | 51% | 57% | 62% |
| 50–54 | 51% | 60% | 65% | 71% | |
| 55–59 | 61% | 69% | 76% | 82% | |
| 60–64 | 74% | 83% | 90% | 97% | |
| Total | 56% | 65% | 71% | 77% | |
| Persons | 45–49 | 45% | 53% | 60% | 66% |
| 50–54 | 52% | 61% | 67% | 74% | |
| 55–59 | 64% | 72% | 79% | 85% | |
| 60–64 | 74% | 84% | 91% | 98% | |
| Total | 57% | 67% | 73% | 80% |
3.4 Projections of missing workers to 2020
According to Health&WealthMOD, 654,423 older Australians were out of the labour force due to chronic health conditions in 2003, with rates of unemployment due to poor health increasing with age. This figure was projected to increase by around one and a half times to 1,263,679 individuals, or 21% of the population aged 45–64, by 2020 (Table 4).
| 2003 | 2010 | 2015 | 2020 | ||
|---|---|---|---|---|---|
| Females | 45–49 | 49,017 | 66,064 | 73,396 | 86,399 |
| 50–54 | 71,680 | 96,367 | 114,080 | 124,187 | |
| 55–59 | 109,338 | 146,996 | 174,574 | 199,578 | |
| 60–64 | 116,261 | 192,569 | 228,286 | 270,994 | |
| Total | 346,297 | 501,996 | 590,336 | 681,158 | |
| Males | 45–49 | 49,109 | 66,467 | 73,719 | 86,393 |
| 50–54 | 55,075 | 72,278 | 85,482 | 92,565 | |
| 55–59 | 88,041 | 114,448 | 136,624 | 158,164 | |
| 60–64 | 115,902 | 183,091 | 208,687 | 245,398 | |
| Total | 308,126 | 436,285 | 504,512 | 582,521 | |
| Persons | 45–49 | 98,126 | 132,532 | 147,115 | 172,792 |
| 50–54 | 126,755 | 168,645 | 199,561 | 216,752 | |
| 55–59 | 197,379 | 261,445 | 311,199 | 357,742 | |
| 60–64 | 232,163 | 375,660 | 436,973 | 516,393 | |
| Total | 654,423 | 938,281 | 1,094,848 | 1,263,679 |
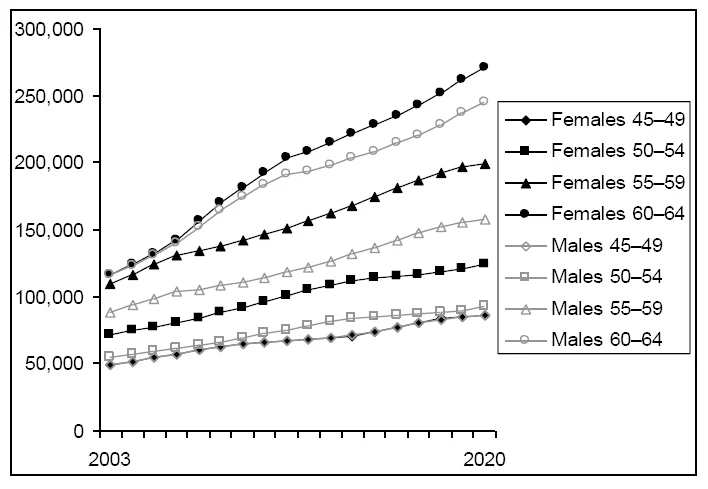
As with the growth in numbers of people with chronic conditions, this increase is largely driven by rapid growth in the 60–64 year age group which experiences the highest prevalence of disease (Figure 2). Between 2003 and 2010 the number of 60–64 year olds who were projected to be out of the labour force because of chronic health conditions swelled from 232,163 to 375,660, an increase of 62%. Over the same period, the number of 45–49 year olds not working due to ill health was projected to rise by 35%, from 98,126 to 132,532 (Table 5).
| 2003 | 2010 | 2015 | 2020 | ||
|---|---|---|---|---|---|
| Females | 45–49 | 7% | 9% | 10% | 11% |
| 50–54 | 11% | 13% | 15% | 16% | |
| 55–59 | 19% | 22% | 24% | 26% | |
| 60–64 | 27% | 31% | 34% | 37% | |
| Total | 15% | 18% | 20% | 22% | |
| Males | 45–49 | 7% | 9% | 10% | 11% |
| 50–54 | 8% | 10% | 11% | 12% | |
| 55–59 | 15% | 17% | 19% | 21% | |
| 60–64 | 26% | 30% | 32% | 35% | |
| Total | 13% | 16% | 17% | 19% | |
| Persons | 45–49 | 7% | 9% | 10% | 11% |
| 50–54 | 10% | 12% | 13% | 14% | |
| 55–59 | 17% | 20% | 21% | 23% | |
| 60–64 | 27% | 31% | 33% | 36% | |
| Total | 14% | 17% | 19% | 21% |
The number of people aged 45–64 years projected to be out of the labour force in 2020 due to ageing and population growth alone, without trends in chronic illness was 904,977, compared with 1,263,679 when trends in illness were captured.
3.5 Sensitivity analysis
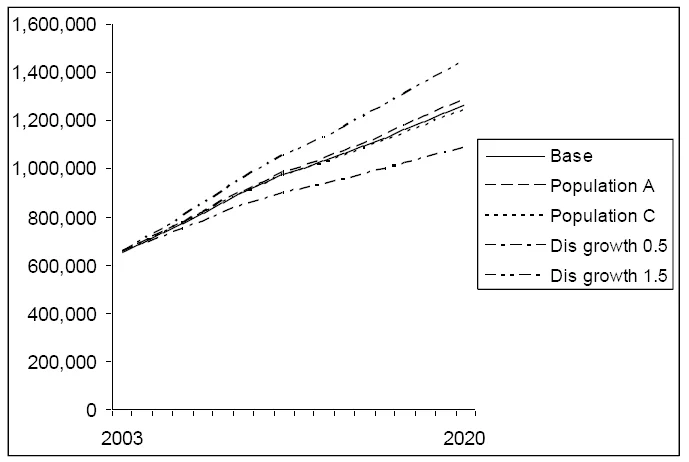
To test the sensitivity of Health&WealthMOD to its underlying assumptions, two components of the base projection were modified: population growth and trends in disease prevalence (Table 6). Using the ABS series A population projections, assuming higher population growth, an additional 19,966 older Australians or 0.32% of the 2020 population aged 45–64 could be expected to be out of the workforce due to ill health by 2020; around 10,100 females and 9,800 males.
| Base projection | High pop growth | Low pop growth | Disease growth *0.5 | Disease growth *1.5 | |||||||
|---|---|---|---|---|---|---|---|---|---|---|---|
| 2003 | 2020 | 2003 | 2020 | 2003 | 2020 | 2003 | 2020 | 2003 | 2020 | ||
| Females | 45–49 | 49,017 | 86,399 | 49,048 | 88,756 | 48,970 | 83,752 | 49,017 | 71,143 | 49,017 | 101,654 |
| 50–54 | 71,680 | 124,187 | 71,718 | 126,657 | 71,624 | 121,441 | 71,680 | 103,680 | 71,680 | 144,693 | |
| 55–59 | 109,338 | 199,578 | 109,386 | 202,280 | 109,271 | 196,512 | 109,338 | 173,959 | 109,338 | 225,196 | |
| 60–64 | 116,261 | 270,994 | 116,309 | 273,598 | 116,194 | 267,888 | 116,261 | 233,856 | 116,261 | 308,133 | |
| Total | 346,297 | 681,158 | 346,461 | 691,290 | 346,059 | 669,594 | 346,297 | 582,639 | 346,297 | 779,676 | |
| Males | 45–49 | 49,109 | 86,393 | 49,149 | 89,061 | 49,049 | 83,406 | 49,109 | 71,314 | 49,109 | 101,473 |
| 50–54 | 55,075 | 92,565 | 55,112 | 94,757 | 55,022 | 90,093 | 55,075 | 78,108 | 55,075 | 107,023 | |
| 55–59 | 88,041 | 158,164 | 88,086 | 160,679 | 87,976 | 155,141 | 88,041 | 136,534 | 88,041 | 179,794 | |
| 60–64 | 115,902 | 245,398 | 115,950 | 247,858 | 115,832 | 241,897 | 115,902 | 215,733 | 115,902 | 275,063 | |
| Total | 308,126 | 582,521 | 308,296 | 592,355 | 307,879 | 570,537 | 308,126 | 501,689 | 308,126 | 663,353 | |
| Persons | 45–49 | 98,126 | 172,792 | 98,197 | 177,816 | 98,019 | 167,158 | 98,126 | 142,457 | 98,126 | 203,127 |
| 50–54 | 126,755 | 216,752 | 126,830 | 221,414 | 126,646 | 211,534 | 126,755 | 181,788 | 126,755 | 251,716 | |
| 55–59 | 197,379 | 357,742 | 197,472 | 362,959 | 197,247 | 351,653 | 197,379 | 310,493 | 197,379 | 404,990 | |
| 60–64 | 232,163 | 516,393 | 232,259 | 521,456 | 232,026 | 509,786 | 232,163 | 449,590 | 232,163 | 583,195 | |
| Total | 654,423 | 1,263,679 | 654,757 | 1,283,645 | 653,938 | 1,240,131 | 654,423 | 1,084,328 | 654,423 | 1,443,029 | |
Conversely, series C projections saw fewer workers lost from the labour force than in the base projections, with 23,548 fewer people out of work because of their health. This included a similar number of additional workforce participants across the four age groups in the study, ranging from 5,218 extra workers aged 50–54 to 6,607 aged 60–64.
Changing the trends of growth of disease prevalence had a substantially greater effect on the number of people aged 45–64 years who were out of the labour force because of a health condition than population assumptions (Fig 3), with a change in either direction of around 3% of the older Australian population. With disease growth set at half that observed from 1993 to 2003, an additional 179,351 people would remain in the workforce in 2020 compared to the base projection. Assuming disease growth rates of 1.5 times the base rates, 179,350 more Australians could be expected to be unable to work due to a chronic condition, including an additional 98,518 women and 80,832 men.
4. Discussion
Ageing of the population and trends in disease prevalence were projected to lead to a substantial rise of approximately 609,000 people out of the labour force due to chronic illness by 2020. This represents a near doubling of the number of people and an increase of 50% in the proportion of people not employed due to ill health. While ageing was expected to produce a net increase of around 250,500 non labour force participants, trends in chronic illness were anticipated to have a considerably greater effect. As a result, Health&WealthMOD was found to be more sensitive to alterations in health trends than to those for demographic assumptions.
The significance of disease trends in shaping the projected increase in missing workers, highlights the critical importance of both primary prevention and early intervention to reduce disability from disease. Lifestyle factors such as smoking, or being sedentary or overweight in midlife have been shown to be predictors of subsequent disability (Vita et al., 1998). While smoking rates in Australia have declined considerably, increases in obesity and reductions in physical activity have been well documented (Australian Institute of Health and Welfare, 2006), and obesity is widely recognised as a major risk factor for multiple chronic diseases and subsequent disability (Sturm et al., 2004; Gill, 2002). Given the strong evidence to support the effectiveness of lifestyle interventions and medications in prevention of chronic disease and subsequent disability (Gillies et al., 2007; Baigent et al., 2005; British Cardiac Society et al., 2005), the findings from Health&WealthMOD provide further evidence to support large-scale investment in these interventions to avert the projected increase in chronic disease with its considerable impact on the future workforce. The model is being further developed to examine the potential impact of interventions to prevent specific conditions and thereby to increase labour force participation.
A linear trend in the growth of the prevalence of chronic illness was assumed in this study. While some chronic conditions such as diabetes, mental health conditions and neurological conditions are expected to rise, other chronic conditions such as neoplasms and circulatory conditions are expected to decline. The trend directions for these conditions for Australian population are consistent with those reported previously (Beggs et al., 2007).
Some of the findings in this paper appear on the surface to differ from other published Australian data. However, apparent inconsistencies between the current findings and those of previous studies are the result of methodological differences. While our data suggests that more women are out of the labour force due to ill health than men (346,297 and 308,126 respectively), the Retirement and Retirement Intentions survey conducted by the ABS (Australian Bureau of Statistics, 1998) found the opposite: 154,300 women had retired due to their own ill health compared to 335,400 men. However, those figures include only people who had retired from full time work and thus women, who are more likely never to have worked full time, are underrepresented. The current study, on the other hand, included all people out of the labour force in 2003 regardless of employment history, resulting in a higher count of women. Proportionally, however, women in this study were less likely to be out of the labour force due to a health condition than their male counterparts (51% and 76% of those out of the labour force respectively). They were also less likely to be out of work due to poor health than for other reasons, both findings consistent with the Retirement and Retirement Intentions survey. address the health conditions associated with low labour force participation. Thus, government Several limitations need to be taken into account while interpreting the results of this study. The chronic illness used in this study is the respondents’ self-reported main condition and co- morbidities are not accounted for. Although self- reported health is regarded as a valid measure (Wannamethee & Shaper, 1991), a possible bias in the results can not be excluded. Similarly, the exclusion of co-morbidities in the study makes the impact estimates of chronic conditions on labour force participation a conservative estimate. Finally, it is assumed in this study that the growth for each group of condition would be linear. It is possible that there will be a flattening out of the trend for each disease at some point. However, there is insufficient data to assess this and while the precise figures may not prove to be exact, the results point to the critical importance of addressing the rising prevalence of chronic conditions as part of labour force policy.
The model estimates the extent to which health is a major driver of labour force participation and retirement. This is important in itself in a country where policy options have focussed on economic incentive to delay retirement such as changes to superannuation taxation (Australian Government, 2006). This paper demonstrates that these economic policies, however important they are, will only have a limited impact on labour force participation, without health policies which policies need to focus on both health interventions to treat or prevent chronic conditions and providing economic incentives to increase the labour force participation of the older working Australian population to ensure an adequate supply of labour in the future.
References
- (2005). The Economic Cost of Arthritis in New Zealand.
- (2005). The Shifting Burden of Cardiovascular Disease in Australia. National Heart Foundation of Australia.
- (2006). The Impact of Age-related Macular Degeneration. Centre for Eye Research Australia.
- (1998). Retirement and Retirement Intentions Survey. Canberra: Australian Bureau of Statistics.
- (2004). 2003 Disability, Ageing and Carers: Summary of findings. Australian Bureau of Statistics.
- (2005). Population Projection for Australia, 2002 – 2101. Canberra: Australian Bureau of Statistics.
- (2004). A more flexible and adaptable retirement income system. Canberra: Commonwealth Government of Australia.
- (2006). A Plan to Simplify and Streamline Superannuation.
- (2001). Australian Health Trends. Canberra: AIHW.
- (2003). Australia’s Welfare. Canberra: AIHW.
- (2006). Australia’s Health. Canberra: AIHW.
- Baigent, C, Keech, A, Kearney, PM (2005). Efficacy and safety of cholesterol-lowering treatment: prospective meta-analysis of data from 90,056 participants in 14 randomised trials of statins. Lancet, 366, 1267–78.
- Beggs, S, Vos, T, Barker, B (2007). The burden of disease and injury in Australia 2003. Canberra: AIHW.
- Begley, CE, Annegers, JF, Swann, A C (2001). The lifetime cost of bipolar disorder in the US: an estimate for new cases in 1998. Pharmacoeconomics, 19, 483–95.
- Bhattacharya, J, Choudhry, K, Lakdawalla, D (2008). Chronic disease and severe disability among working-age populations. Med Care, 46, 92–100.
- (2005). JBS 2: Joint British Societies’ guidelines on prevention of cardiovascular disease in clinical practice. Heart, 91, v1–52.
- (2002). Intergenerational Report 2002–03. Intergenerational Report 2002–03.
- (2007). Intergenerational Report 2007–08. Intergenerational Report 2007–08.
- (2005). Doorstop Interview Toorak Place Retirement Village. http://www.treasurer.gov.au/DisplayDocs.asp x?doc=transcripts/2005/143.htm&pageID=004&min=phc&Year=2005&DocType=2.
- Crimmins, EM, Saito, Y, Reynolds, SL (1997). Further evidence on recent trends in the prevalence and incidence of disability among older Americans from two sources: the LSOA and the NHIS. J Gerontol B Psychol Sci Soc Sci, 52, S59–71.
- Davis, M (2006). Future shock: Costello’s tax warning.
- Gill, T (2002). Importance of preventing weight gain in adulthood. Asia Pac J Clin Nutr, 11, S632–6.
- Gillies, CL, Abrams, KR, Lambert, PC (2007). Pharmacological and lifestyle interventions to prevent or delay type 2 diabetes in people with impaired glucose tolerance: systematic review and meta-analysis. Bmj, 334.
- Henriksson, F, Jonsson, B (1998). The economic cost of multiple sclerosis in Sweden in 1994. Pharmacoeconomics, 13, 597–606.
- Howard, J (2003). Address to the Symposium on Mature Age Luncheon. http://pandora.nla.gov.au/pan/10052/200311 21-0000/www.pm.gov.au/news/speeches/speech4 62.html.
- Lakdawalla, DN, Bhattacharya, J, Goldman, DP (2004). Are the young becoming more disabled?. Health Aff (Millwood), 23, 168–76.
- Lixin, C, Kalb, G (2004). Health status and labour force participation: Evidence from the HILDA data. Melbourne: Melbourne Institute of Applied Economic and Social Research.
- Manton, K G, Corder, L, Stallard, E (1997). Chronic Disability Trends in Elderly United States Populations: 1982–1994. Proceedings of the National Academy of Sciences of the United States of America, 94, 2593–2598.
- Moncrieff, J, Pomerleau, J (2000). Trends in sickness benefits in Great Britain and the contribution of mental disorders. J Public Health Med, 22, 59–67.
- Moore, R, Mao, Y, Zhang, J (1997). Economic Burden of Illness in Candada 1993. Ottawa: Public Health Agency of Canada.
- (2005). Economic implications of an ageing Australia. Canberra: Productivity Commission.
- Schofield, D, Rothman, G (2006). Projections of Commonwealth Health Expenditure in Australia’s First Intergenerational Report. Modelling Our Future: Population Ageing, Health and Aged Care. A. Gupta and A. Harding. Projections of Commonwealth Health Expenditure in Australia’s First Intergenerational Report. Modelling Our Future: Population Ageing, Health and Aged Care. A. Gupta and A. Harding.
- Schofield, DJ, Shrestha, RN, Passey, ME (2008). Chronic disease and labour force participation among older Australians. Med J Aust, 189, 447–50.
- Sturm, R, Ringel, JS, Andreyeva, T (2004). Increasing obesity rates and disability trends. Health Aff (Millwood), 23, 199–205.
- Vita, A, Terry, R, Hubert, H (1998). Aging, health risks, and cumulative disability. New England Journal of Medicine, 338, 1035–1041.
- Wannamethee, G, Shaper, AG (1991). Self-assessment of health status and mortality in middle-aged British men. Int J Epidemiol, 20, 239–45.
- (2005). Preventing Chronic Diseases: A Vital Investment. Geneva: WHO.
- Zhang, X, Zhao, X, Harris, A (2009). Chronic diseases and labour force participation in Australia. J Health Econ, 28, 91–108.
Article and author information
Author details
Acknowledgements
This study is part of ongoing research funded by an Australian Research Council Grant (Grant No. LP0774919) and by Pfizer Australia.
Publication history
Copyright
© 2011, Schofield et al.
This article is distributed under the terms of the Creative Commons Attribution License, which permits unrestricted use and redistribution provided that the original author and source are credited.