
Jump to
1. Introduction
Treatment of paediatric cancer is one of the greatest success stories of modern medicine (Smith et al., 2014) and the success was exemplified by the treatment of acute lymphoblastic leukaemia (ALL), one of the most common types of paediatric cancers. The disease has progressed from being incurable in the 1950s to a current 5-year survival rate of 90% (Cools, 2012). Improvements in survival outcome were observed among other childhood cancers, including Wilms tumour, non-Hodgkin lymphoma (NHL), Hodgkin lymphoma, and germ cell tumours (Smith et al., 2014). These improvements are largely due to identifying various subtypes of the disease and adopting risk-based treatment strategies by stratifying cancer according to various biomarkers. However, the improvement in rate of survival has been reaching a plateau for some cancer types, including Diffuse Intrinsic Pontine Glioma (DIPG) and rhabdoid tumours, with little or no improvement over decades with current approaches, and thus, new treatment approaches such as precision medicine are now needed to further improve survival rates in childhood cancers (Forrest et al., 2018; Pritchard-Jones et al., 2013; Seibel et al., 2017; Tran et al., 2017). Precision medicine is an approach to patient care that allows doctors to tailor treatments according to patient’s genetic makeup. Both somatic (non-hereditary) and germline (hereditary) mutations information are important in precision medicine, where the interaction between germline and somatic mutations was found to drive the development of paediatric cancer (Sweet-Cordero and Biegel, 2019). Survivors of childhood cancers often suffer from treatment related toxicity either during the treatment or later in life, and researchers are hoping that the effect can be ameliorated via the use of precision medicine.
Australian Institute of Health and Welfare (AIHW) reported that approximately 70% of cancer costs were attributed to hospitalisation for patients in the age group of 0-19 years (Australian Institute of Health and Welfare, 2019b). Healthcare costs of cancer for children aged 0-19 years were about AU$290m in 2015-2016 (Australian Institute of Health and Welfare, 2019b). Cancer was the most common cause of death from chronic disease among children, and leukaemia was reported as one of the most common childhood cancers.
Due to the advancement in medical science and genome sequencing technology, there is an increasing number of studies that have identified mutations at the genomic level unique to cancer patients, which led to potential application of genomic-guided precision medicine (Gröbner et al., 2018; Rehm, 2017; Turnbull, 2018). The increased investigative power of Next Generation Sequencing (NGS), coupled with a decreasing cost of performing sequencing, has enabled many institutions to perform Whole Exome Sequencing (WES) or Whole Genome Sequencing (WGS) on significant numbers of tumour samples (Vis et al., 2017). Although there is a growing effort in the field of medicine to implement precision medicine treatment for cancer patients via genome sequencing, no economic evaluation of genome sequencing has been reported for the treatment of childhood leukaemia or other childhood cancers, which is critical to evaluate the feasibility of implementing patient’s genome sequencing as part of the treatment strategy. Our recent review of cost-effectiveness studies of using NGS in cancer management has found that there were only six studies reporting on the application of genome sequencing technology in cancer, suggesting more evidence is required in order to implement this approach into clinical care for childhood cancer patients (Tan et al., 2018). Thus, there is a need to develop a modelling approach for cost and effectiveness of precision medicine program in childhood cancer precision medicine studies. The structure of precision medicine trials is complicated especially with “basket” trials, designed to identify biomarkers that occur at either a low or unknown frequency across diseases (Weymann et al., 2019). Sequencing results from a “basket” trial would subsequently lead to multiple sub-treatment arms or clinical trials that treat patients with drugs targeting specific genomic variants, with only a few eligible subjects being enrolled into each sub-treatment arm. This heterogeneity of “basket” trials makes modelling them using decision trees, or Markov Chain models challenging in low frequency diseases.
We propose to create a microsimulation model, Paediatric Cancer MOD (PeCanMOD), capable of simulating costs and benefits of precision medicines. Microsimulation, traditionally used in policy for income and tax modelling, has increasingly been applied in healthcare research (Rutter et al., 2011; Schofield et al., 2018). Application of microsimulation model in health and healthcare research include study of cost-effectiveness, mortality, disease prevalence and burden, population screening program, spatial model, disease transmission, and healthcare policy evaluation (Schofield et al., 2018). Our proposed model is a static microsimulation model to evaluate the cost-effectiveness of precision medicine in paediatric cancer. Microsimulation is undertaken at an individual level and can accommodate different treatments and outcomes for each individual. Thus, this modelling approach is well suited for handling heterogeneity in genetic differences and targeted therapies in precision medicine studies. In this paper, we have described the structure of the model, and expected outputs from PeCanMOD. To our knowledge, this is the first such model of this kind applied to precision medicine and paediatric cancer.
2. Materials and methods
2.1. Base population
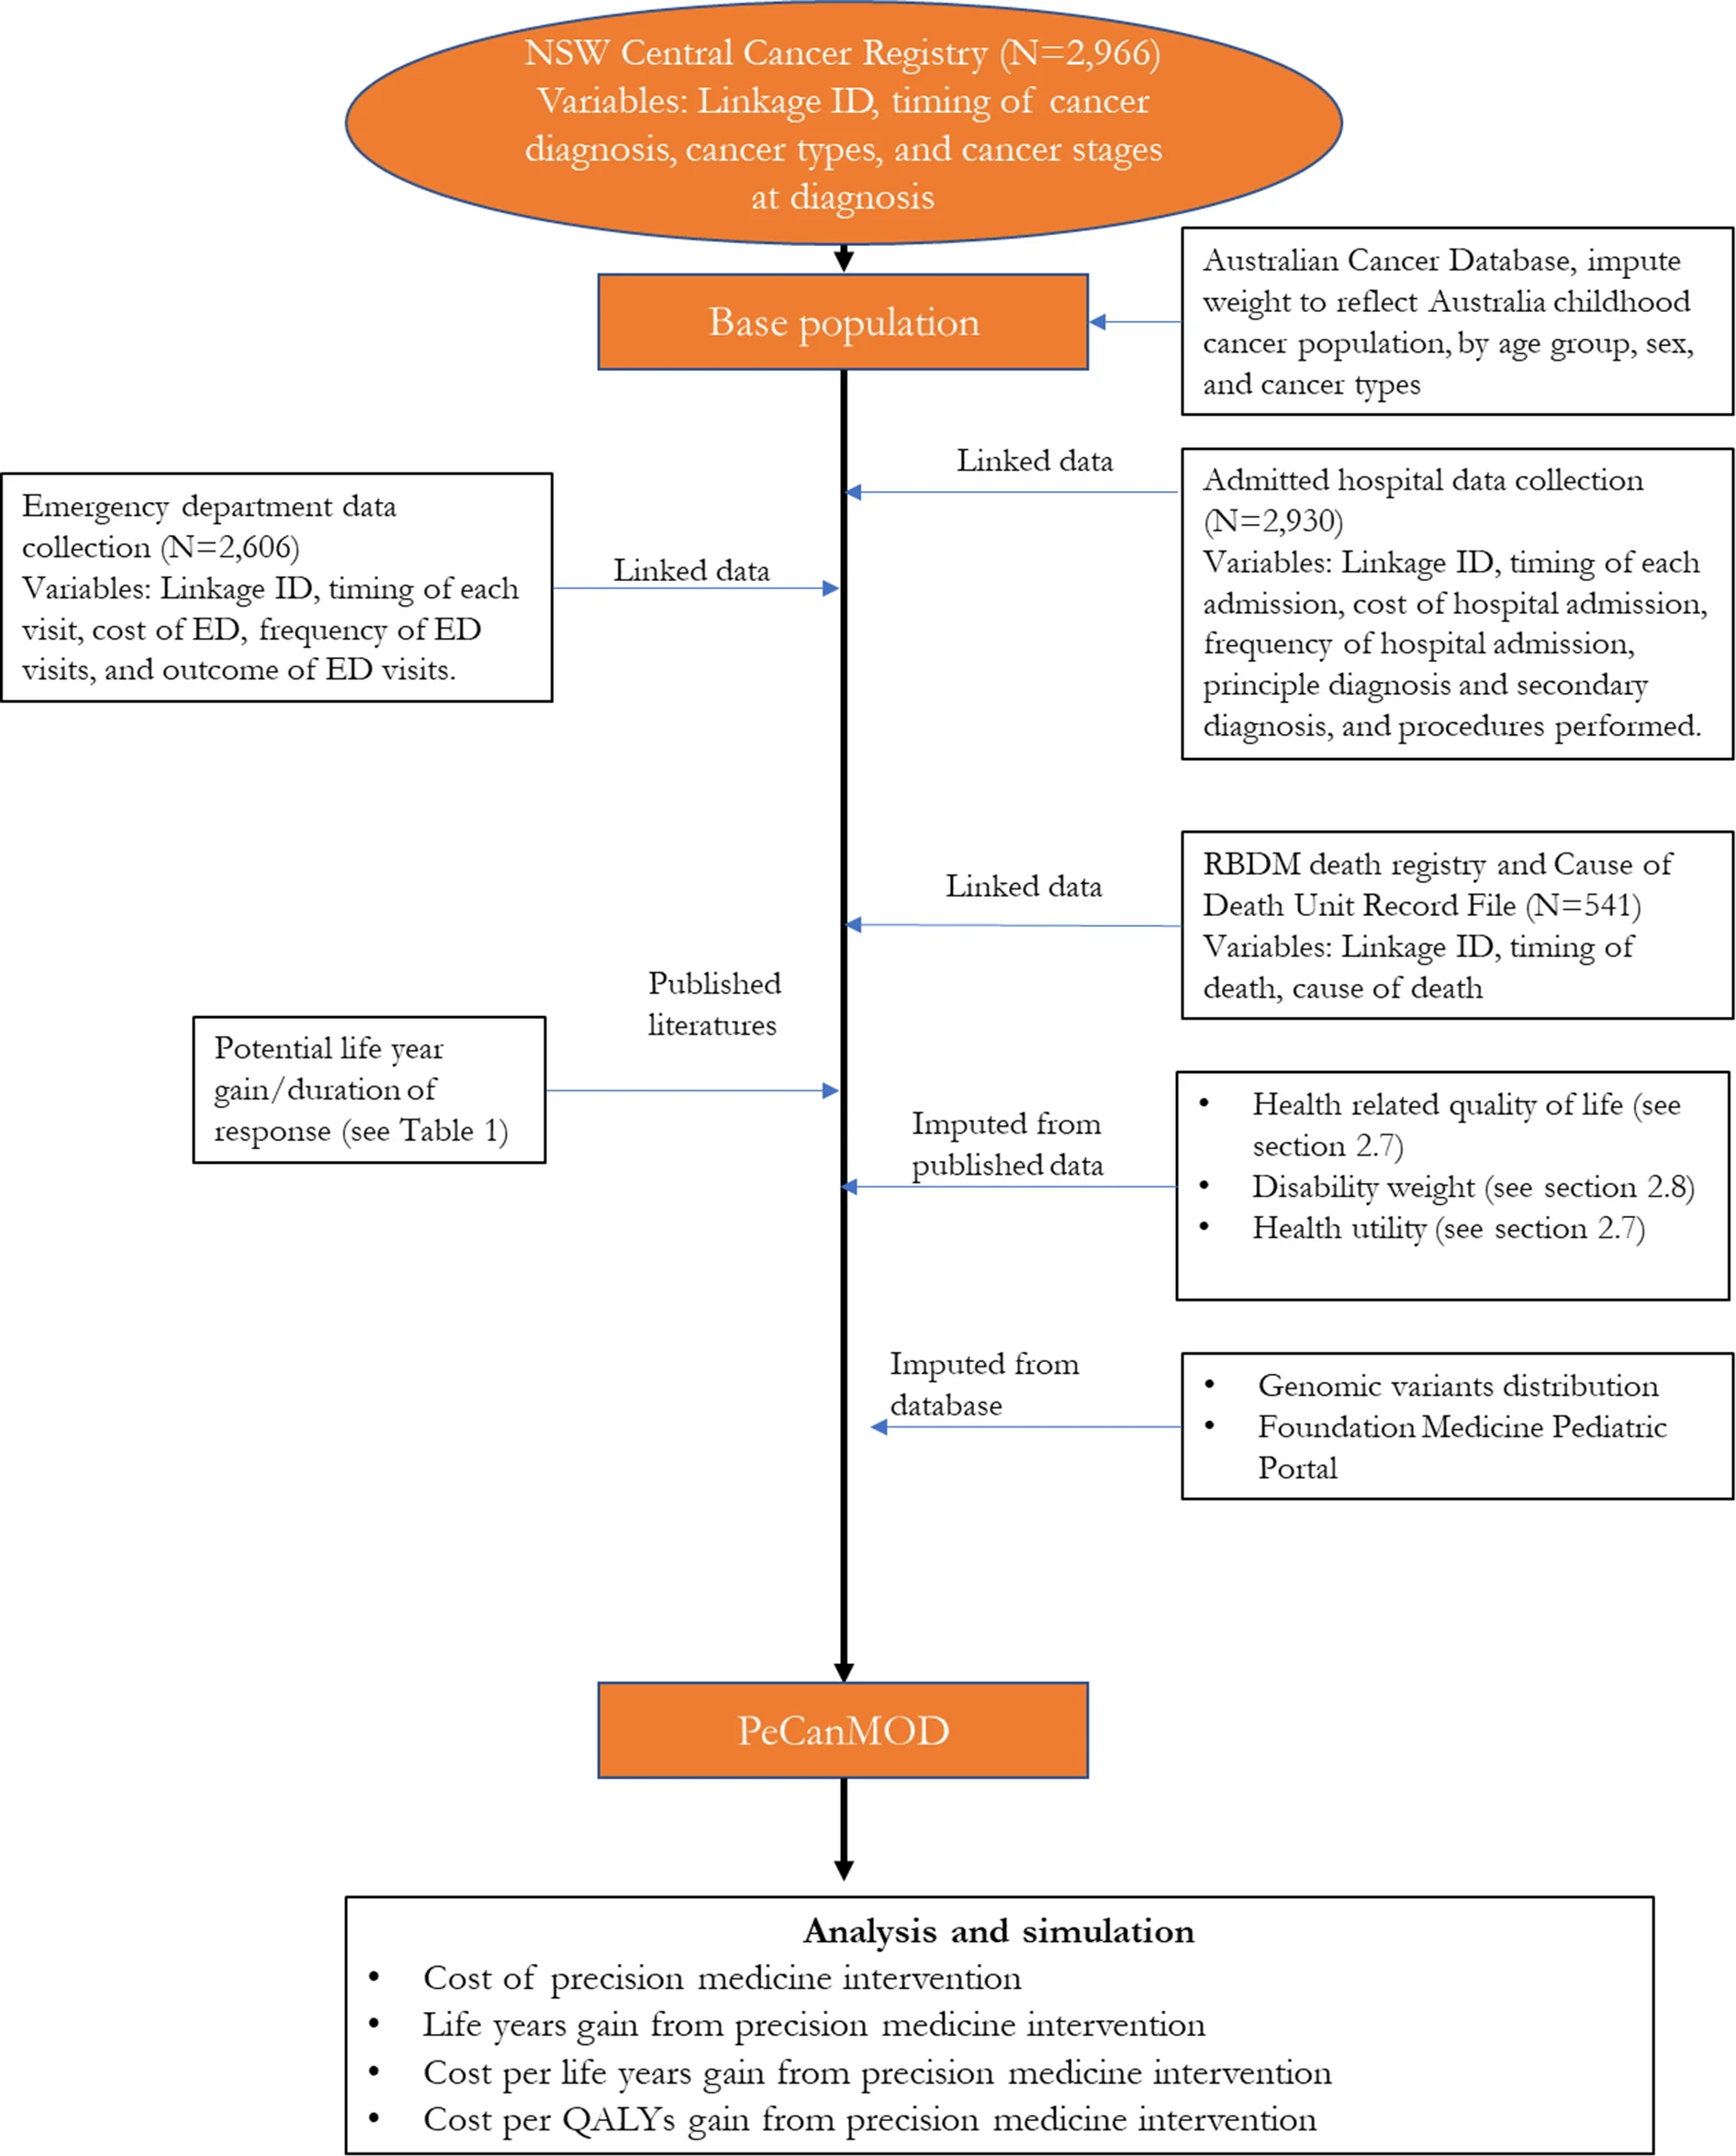
The model is developed with inputs from multiple datasets (Figure 1). The base population in the model is sourced from the New South Wales (NSW) Central Cancer Registry which contains records of people who have had cancer in NSW (Cancer Institute, 2018). The study cohort comprised children aged <18 years, who were registered in the NSW Central Cancer Registry as cancer patients with a date of diagnosis between 1 July 2001 and 31 December 2012. Characteristics of the base population are presented in Table 1.
| Total childhood cancer population from NSW Central Cancer Registry (2001-2012) | Selected individuals for simulation model ‡ | ||||
|---|---|---|---|---|---|
| N | % | N | % | ||
| Sex | Sex | ||||
| Male | 1639 | 55.26 | Male | 303 | 56.01 |
| Female | 1327 | 44.74 | Female | 238 | 43.99 |
| Age at diagnosis | Age at diagnosis | ||||
| 0-4 | 1117 | 37.66 | 0-4 | 193 | 35.67 |
| 5-9 | 528 | 17.8 | 5-9 | 99 | 18.3 |
| 10-14 | 632 | 21.31 | 10-14 | 119 | 22 |
| 15-17 | 689 | 23.23 | 15-17 | 130 | 24.03 |
| Cancer types | Cancer types | ||||
| -Acute lymphoblastic leukaemia | 712 | 23.78 | Brain | 159 | 29.39 |
| -Brain | 342 | 11.42 | Acute lymphoblastic leukaemia | 92 | 17.01 |
| -Hodgkin’s disease | 210 | 7.01 | Bone | 54 | 9.98 |
| -Non-Hodgkin’s lymphoma | 186 | 6.21 | Acute myeloid leukaemia | 42 | 7.76 |
| -Bone | 177 | 5.91 | Connective tissue, peripheral nerves | 38 | 7.02 |
| -Acute myeloid leukaemia | 168 | 5.61 | Other endocrine glands | 33 | 6.1 |
| -Connective tissue, peripheral nerves | 148 | 4.94 | Non-Hodgkin’s Lymphoma | 22 | 4.07 |
| -Kidney | 134 | 4.48 | All other cancer types† | 101 | 18.6 |
| -Other endocrine glands | 113 | 3.77 | |||
| -Melanoma of skin | 106 | 3.54 | |||
| -Colon | 70 | 2.34 | |||
| -Thyroid | 68 | 2.27 | |||
| -Testis | 67 | 2.24 | |||
| -Central nervous system | 67 | 2.24 | |||
| -Ill-defined and unspecified site | 60 | 2 | |||
| -Eye | 59 | 1.97 | |||
| -Other lymphatic, hematopoietic | 49 | 1.64 | |||
| -Liver | 41 | 1.37 | |||
| -Ovary | 41 | 1.37 | |||
| -Other myeloid leukaemia | 27 | 0.9 | |||
| -Other thoracic organs | 20 | 0.67 | |||
| -All other cancer types† | 129 | 4.31 | |||
| Year of diagnosis | Year of diagnosis | ||||
| 2001* | 144 | 4.86 | 2001* | 34 | 6.28 |
| 2002 | 261 | 8.80 | 2002 | 60 | 11.09 |
| 2003 | 249 | 8.40 | 2003 | 58 | 10.72 |
| 2004 | 259 | 8.73 | 2004 | 45 | 8.32 |
| 2005 | 241 | 8.13 | 2005 | 52 | 9.61 |
| 2006 | 261 | 8.80 | 2006 | 41 | 7.58 |
| 2007 | 229 | 7.72 | 2007 | 45 | 8.32 |
| 2008 | 226 | 7.62 | 2008 | 40 | 7.39 |
| 2009 | 256 | 8.63 | 2009 | 46 | 8.5 |
| 2010 | 270 | 9.10 | 2010 | 40 | 7.39 |
| 2011 | 277 | 9.34 | 2011 | 32 | 5.91 |
| 2012 | 293 | 9.88 | 2012 | 48 | 8.87 |
2001 data started from 1st of July.
Including cancer types with equal or less than 20 records.
Selected individuals were those who were eventually deceased due to their illness.
2.1.1. Data sources
NSW Central Cancer Registry maintains records of all cases of cancer diagnosed in NSW residents. To study paediatric cancer population, we selected data of all NSW cancer patients diagnosed with cancer under the age of 18. Key variables used in the model include linkage ID, timing of cancer diagnosis, cancer types, and cancer stages at diagnosis.
NSW Admitted Patient Data Collection includes records for all hospital separations (discharges, transfers, and deaths) from all NSW public and private hospitals and day procedure centres. Key variables used in the model include timing of each admission, cost of hospital admission, separation outcome, frequency of hospital admission, principle diagnosis and secondary diagnosis, and procedures performed.
NSW Emergency Department Data Collection provides information about presentations to the Emergency Departments in NSW. Key variables used in the model include timing of each visit, cost of emergency service, frequency of visits, and outcome of visits.
Registry of Births, Deaths and Marriages, and Cause of Death Unit Record File contain information of all registered deaths in NSW and cause of death. Key variables used in the model include timing of death, and cause of death.
2.2. PeCanMOD structure
Globally, there were multiple large-scale precision medicine clinical trials designed for treating high-risk paediatric cancer (Chang et al., 2016; Harttrampf et al., 2017; Khater et al., 2019; Mody et al., 2015; Wong et al., 2020; Worst et al., 2016). Patients who had previous treatment failure, experiencing cancer relapsed, or were diagnosed with high-risk cancer (less than 30% 5-year survival rate) were the major participants in these precision medicine studies.
To reflect the current practice, the model assumed that individuals who were eventually decreased due to their illness would be simulated to have been eligible for precision medicines in our simulation prior to their death. These individuals were assumed to be high risk patients, who were unlikely to be cured with the current treatment regime. We identified these individuals from the NSW Central Cancer Registry by linking the dataset to other administrative datasets. Each individual in the NSW Central Cancer Registry dataset was assigned a unique identifier by the Centre for Health Record Linkage (Centre for Health Record Linkage, 2018), and data for these individuals were extracted from the other administrative datasets such as the NSW Registry of Births, Deaths, Marriages, and NSW Cause of Death Unit Record File. Records were then linked based on the unique identifier for each patient. The NSW Registry of Births, Deaths, and Marriages death registrations and the NSW Cause of Death Unit Record File records date of death, and cause of death (Figure 1).
2.3. Imputation of genomic variants
Understanding the prevalence of genomic variants responsible for cancer development is critical to estimate the effectiveness of a precision medicine programme (Subbiah et al., 2018). We imputed genomic variants responsible for cancers using published data from the Foundation Medicine Pediatric Portal (Chmielecki et al., 2016; Chmielecki et al., 2017). The dataset consists of the molecular profiles of over 1200 paediatric tumours sequenced by the Foundation Medicine. We estimated the prevalence of genomic variants in each cancer type from this dataset. Imputation of having specific genomic variant was carried out based on the distribution of genomic variants in each cancer type (55 categories) and allocated using Monte Carlo simulation method to the matched cancer type. We have considered other data sources (Gröbner et al., 2018; Ma et al., 2018; Rusch et al., 2018), but none were as comprehensive as the Foundation Medicine dataset in terms of cancer types (Table 2).
| Datasets | % of base file matched with reference dataset (by cancer types) |
|---|---|
| Foundation Medicine Pediatric Portal | 73 |
| Grobner et al. | 57 |
| Rusch et al. | 24 |
| Ma et al. | 10 |
2.4. Simulation
To model genomic variants, we assigned a random value between 0 to 1 drawn from a uniform distribution to individuals in the cancer registry. Controlling for cancer types, if the value falls between the upper and lower bounds for a gene, then the individual would be assigned the associated gene in this simulation. The simulation process was repeated 1,000 times.
The treatment protocol was mostly based on one of the largest paediatric cancer precision medicine trials, NCI-COG Pediatric MATCH (MATCH) (Table 3) (Allen et al., 2017). Due to limited evidence of the effectiveness of precision medicine as well as limited understanding of the distribution of actionable variants within the patient population, we have made several assumptions in our current model, and the model will be updated as results from the precision medicine trials become available. Treatment response rate and survival duration used in this model were sourced from clinical trials results on adult cancers (Tables 4 and 5) as there were no reported outcomes of these medications for childhood cancer cohort. It is possible that children’s response to these medicines may be different to their adult counterpart’s (Joseph et al., 2015). A one-way sensitivity analysis on response rate and duration of response will be conducted to estimate resulting cost and effectiveness in best- and worst-case scenarios (range of input parameters are described in Tables 4–6). Method for sensitivity analysis is described in 2.10.
| Drugs | Genomic variants eligible for precision medicine |
|---|---|
| Larotrectinib | NTRK1,NTRK2,NTRK3 |
| Erdafitinib | FGFR1,FGFR2,FGFR3,FGFR4 |
| Tazemetostat | EZH2 gain of function,EZH2,BRG1,INI1,SMARCA4 inactivation,SMARCB1 inactivation |
| Samotolisib | TSC1,TSC2 |
| Selumetinib Sulfate | BRAF,GNA11,GNAQ,HRAS,KRAS,NF1,NRAS |
| Ensartinib | ALK fusion protein, ALK gene mutation, ALK gene translocation,ROS1 fusion positive,ROS1 gene mutation,ROS1 gene translocation |
| Vemurafenib | BRAF v600x |
| Olaparib | Deleterious ATM, Deleterious BRCA1, Deleterious BRCA2, Deleterious RAD51C, Deleterious RAD51D |
| Palbociclib | RB1 |
| Ulixertinib | ARAF,BRAF,GNA11,GNAQ,HRAS,KRAS,MAP2K1,MAPK1,NF1,NRAS |
| Drugs | Mean response rate | Distribution § | Source/note |
|---|---|---|---|
| Larotrectinib | 0.73 | Binomial (55,0.73) | Food and Drug Administration, 2018 |
| Erdafitinib | 0.322 | Binomial (87,0.322) | Food and Drug Administration, 2019 |
| Tazemetostat* | 0.38 or 0.05 | Binomial(21,0.38) or Binomial(43,0.05) | Italiano et al., 2018 |
| Samotolisib | 0.34 | Binomial (47,0.34) | Bendell et al., 2018 |
| Selumetinib Sulfate | 0.17 | Binomial (36,0.17) | Jain et al., 2014 |
| Ensartinib | 0.69 | Binomial (13,0.69) | Horn et al., 2017 |
| Vemurafenib† | range (0.17-0.769) | Hyman et al., 2015 | |
| Olaparib | 0.53 | Binomial (92,0.53) | Golan et al., 2019 |
| Palbociclib‡ | 0.5 | Triangular (0.25, 0.5, 0.75) | n.a. |
| Ulixertinib | 0.14 | Binomial (101,0.14) | Sullivan et al., 2018 |
Depending on cancer types (for blood cancers, response rate was assumed to be 0.38, and 0.05 for solid cancers).
response rate varies by cancer types.
There is no data available for Palbociclib, so we assumed 0.5 response rate with a triangular distribution of ±0.25.
Binomial (N,p), triangular (a, c, b).
| Drugs | Mean duration of response | Weibull (shape, scale) | Source/note |
|---|---|---|---|
| Larotrectinib | 6 months | (2.45,10.45) | Food and Drug Administration, 2018 |
| Erdafitinib | 5.4 months | (1.86,6.58) | Food and Drug Administration, 2019 |
| Tazemetostat | 12.4 months | (1.8,19.7) | Italiano et al., 2018 |
| Samotolisib | 6 months | (1.55,7.6) | Bendell et al., 2018 |
| Selumetinib Sulfate | 2 months | (1.3,2.65) | Jain et al., 2014 |
| Ensartinib | 5.8 months | (1.57,7.3) | Horn et al., 2017 |
| Vemurafenib* | range (3-13 months) | (1.81,8.57) | Hyman et al., 2015 |
| Olaparib | 6 months | (1.95,21.73) | Golan et al., 2019 |
| Palbociclib | 9.5 months | (1.53,12.06) | McShane et al., 2018 |
| Ulixertinib | 6.6 months | (1.73,8.16) | Sullivan et al., 2018 |
Duration of response varies by cancer types.
| Drugs | Mean monthly cost (US$) | Mean monthly cost (AU$) | Source/note |
|---|---|---|---|
| Larotrectinib | 11,000 (range: 8,250-13,750) | 15,629 (range:11,722-19,536) | Herper, 2018 |
| Erdafitinib | 16,380 (range: 12,285-20,475) | 23,273 (range: 17,455-29,091) | Pagliarulo, 2019 |
| Tazemetostat | N/A | 11,658 (range: 8,744-14,573) | Average of drug prices of Larotrectinib, Erdafitinib, Vemurafenib, Olaparib, and Palbociclib |
| Samotolisib | N/A | 11,658 (range: 8,744-14,573) | Average of drug prices of Larotrectinib, Erdafitinib, Vemurafenib, Olaparib, and Palbociclib |
| Selumetinib Sulfate | N/A | 11,658 (range: 8,744-14,573) | Average of drug prices of Larotrectinib, Erdafitinib, Vemurafenib, Olaparib, and Palbociclib |
| Ensartinib | N/A | 11,658 (range: 8,744-14,573) | Average of drug prices of Larotrectinib, Erdafitinib, Vemurafenib, Olaparib, and Palbociclib |
| Vemurafenib | N/A | 8,189 (range: 6,142-10,236) | Pharmaceutical BenefitsScheme, 2019c |
| Olaparib | N/A | 6,961 (range: 5,221-8,701) | Pharmaceutical BenefitsScheme, 2019a |
| Palbociclib | N/A | 4,239 (range: 3,179-5,299) | Pharmaceutical BenefitsScheme, 2019b |
| Ulixertinib | N/A | 11,658 (range: 8,744-14,573) | Average of drug prices of Larotrectinib, Erdafitinib, Vemurafenib, Olaparib, and Palbociclib |
| Hospital care | Mean monthly cost per person (US$) | Mean monthly cost per person (AU$) | |
| Admission for drug treatment | N/A | 901 (range: 676-1,126) | AR-DRGs |
| Managing toxicity/adverse drug events | N/A | 5,230 (range: 3,923-6,538) | |
| Sequencing | Mean cost per service (USD) | Mean cost per service (AUD) | |
| Whole-genome sequencing | 3,347 (range: 2,032-30,805) | 4,926 (range: 2,991-45,333) | Gordon et al., 2020; Schwarze et al., 2020; Schwarze et al., 2018; Weymann et al., 2017 |
| Targeted multi-gene panel sequencing | 1,236 (range: 525-6916) | 1,433 (range: 773-10,178) | Gordon et al., 2020; Hamblin et al., 2017an van Amerongen et al., 2016; Yu et al., 2018 |
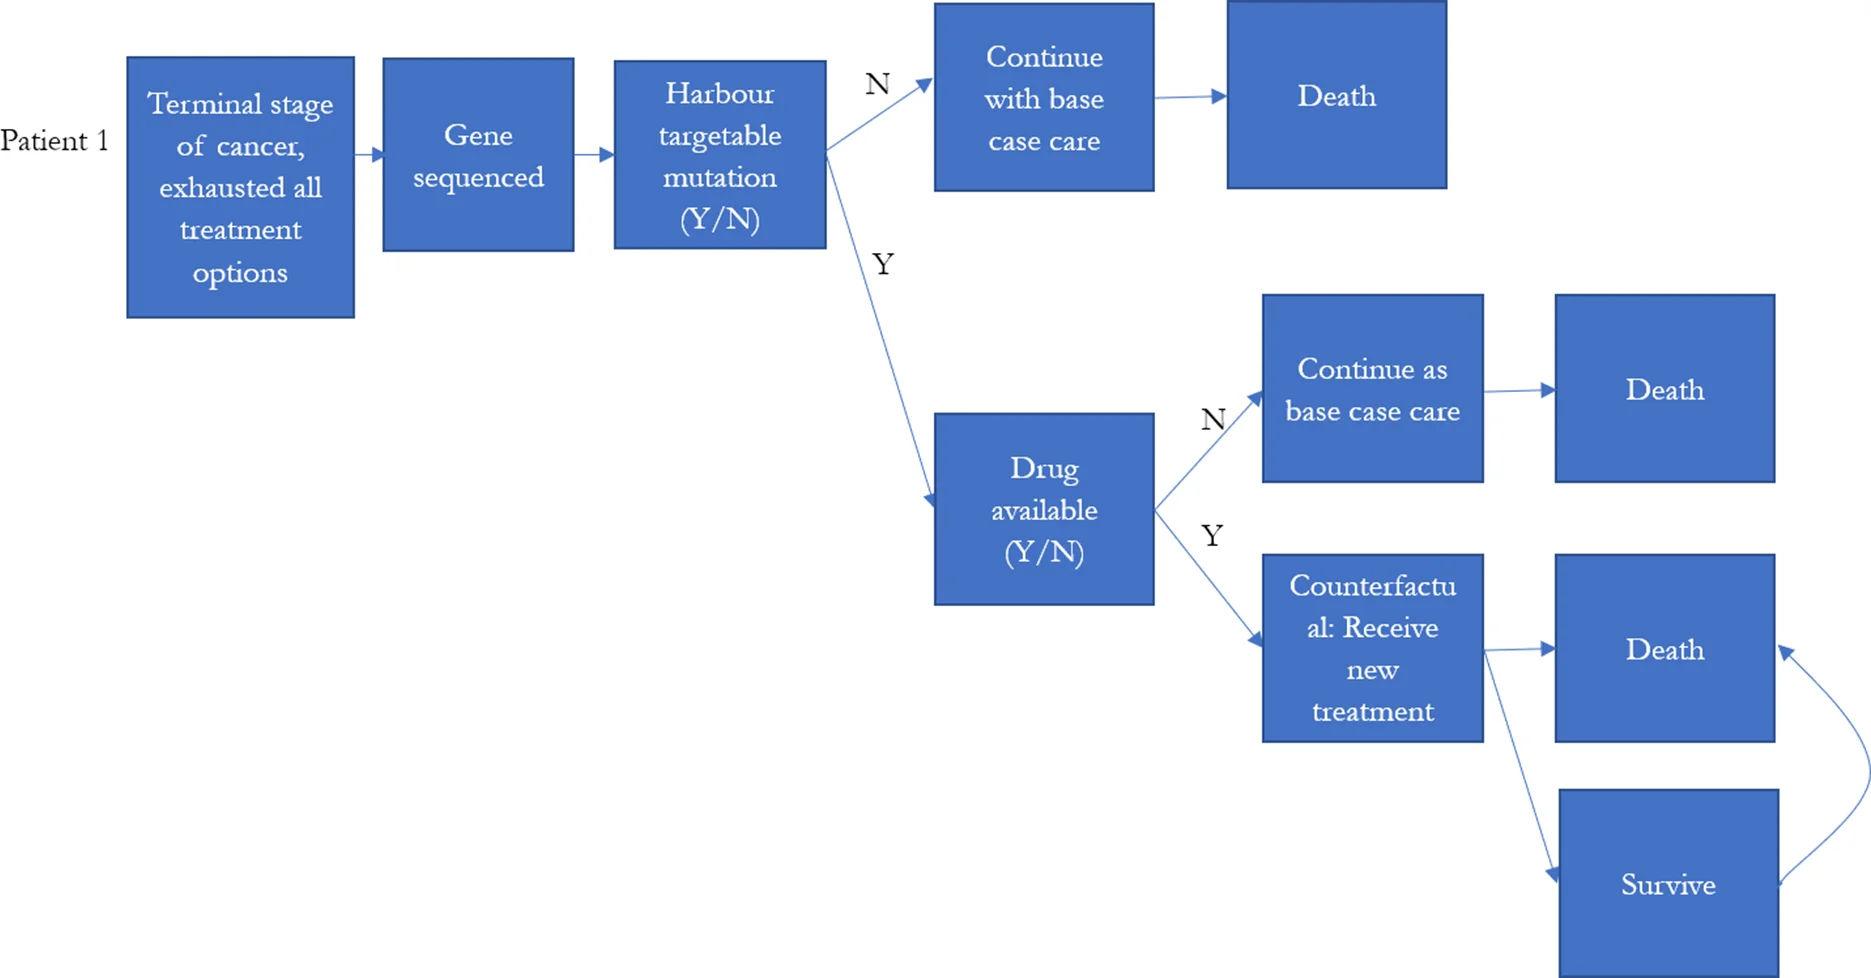
The model simulated the number of individuals eligible for precision medicine, and the cost of treatment per life year gained if precision medicine was introduced to late stage cancer patients as final treatment options (Figure 2). The probability of responding to precision medicine for each genomic variant and duration of response were estimated based on published literature or reports from the U.S. Food and Drug Administration (Table 4). They were used to estimate the incremental life years that would have been gained for each individual in our base population if they had had one of the 10 targeted therapies from the MATCH trial for their specific simulated genomic variant, with the assumption that the patients died if they failed to respond, and that if they did respond, the patients would only survive as long as the duration of response (Table 5).
2.5. Cost of Next-Generation Sequencing (NGS)
The model assumes that each patient receives Whole-Genome Sequencing (WGS) at a cost of AU$4,926 per cancer patient (range: AU$2,991-AU$45,333) (reported costs were inflated to 2019 values by the consumer price index in origin country, and converted to Australian dollars using Purchasing Power Parities) (Table 6) (Gordon et al., 2020; Schwarze et al., 2020; Schwarze et al., 2018; Weymann et al., 2017) . Note that the cost of WGS included all steps in the sequencing pathway, including the costs of bioinformatic analysis and returning results. We also model the cost and effectiveness if each patient receives targeted multi-gene panel sequencing versus WGS. The cost of targeted multi-gene panel sequencing is assumed to be AU$1,433 (range: AU$437-AU$10,178) per sample (Gordon et al., 2020; Hamblin et al., 2017; van Amerongen et al., 2016; Yu et al., 2018).
2.6. Cost of drugs and managing toxicity
For the base case, the cost of hospital admission for precision medicine was assumed to be the same as the cost of hospital admission for chemotherapy less the direct cost relating to pharmacy, and was estimated based on Australian Refined Diagnosis Related Groups version 8.0 (AR-DRGs). AR-DRGs is a classification system to classify patient hospital admissions by connecting the number and type of patients treated in a hospital (known as hospital casemix) to the resources required by the hospital. For drugs that do not require inpatient care, we will refer to outpatient service cost for chemotherapy administration. Costs of managing toxicity or adverse events from treatment were assumed to be AU$5,890 per month per person (based on our (unpublished) analysis of the NSW Admitted Patient Data Collection linked to the NSW Central Cancer Registry) (Table 6).
The costs of drugs in the model are based on published costs from the Pharmaceutical Benefits Scheme (Pharmaceutical BenefitsScheme, 2019a; Pharmaceutical BenefitsScheme, 2019b; Pharmaceutical BenefitsScheme, 2019c), or online materials (Herper, 2018; Pagliarulo, 2019), or imputed as the mean of available costs (e.g. Tazemetostat, Samotolisib, Selumetinib Sulfate, Ensartinib, and Ulixertinib) (Table 6).
All costs were presented in 2019 Australian dollars. For costs not originally reported in Australian dollars or in 2019 cost base, we inflated the reported costs to 2019 by the consumer price index in origin country and converted to Australian dollars using Purchasing Power Parities.
2.7. Health utility
Health Related Quality of Life (HRQoL) measures the impact of health states on patient’s quality of life. In the context of cost-utility analysis, HRQoL is summarised into utility values ranging between 0 (death) and 1 (perfect health). Utility measurements allow for comparison of health outcomes across diseases as well as comparison between various health care interventions. In PeCanMOD, we impute utility based on cancer type, treatment phase, health outcome, age, and gender from published literature. A review by Tarride et al. (2010) has summarised the health utilities measured for Acute Lymphoblastic Leukaemia patients during treatment (range: 0.81-0.91), and survivors of various cancers . Yeh et al. (2016) measured and reported that health utility among childhood cancer survivors is significantly poorer than health utility for the general population. In addition, a systematic review and meta-analysis of child health utilities by Kwon et al. (2018) reported utilities for a wide range of health conditions, including cancers.
2.8. Disability adjusted life years (DALYs)
Health utility data is scarce for most childhood cancers, especially during the treatment phase. To model health outcomes we used Disability-Adjusted Life Year (DALY). DALYs is a standard metric used to describe burden of disease. This value is calculated using the Years of Life Lost (YLL) and the Years Lived With Disability (YLD). The Global Burden of Disease Study (Global Burden of Disease Collaborative Network, 2018) reported the DALY burden due to childhood cancers (GBD 2017 Childhood Cancer Collaborators, 2019). We attributed DALYs based on patients’ response to precision medicine during the microsimulation. The model will first determine YLD with estimated duration of response to precision medicine and corresponding disability weight for treatment phase and cancer types. As we assumed that once patient will only survive as long as the duration of response, we will determine YLL based on the life expectancy at the counterfactual age at death.
2.9. Budget impact analysis
The model assigns a multiplier to individuals to reflect the number of childhood cancer patients within the Australian population. The AIHW published childhood cancer incidence between 1982-2015 (Australian Institute of Health and Welfare, 2019a ), and the multipliers are assigned to the total costs incurred by each individual in the NSW Central Cancer Registry, by age group at diagnosis, cancer types, sex, and year of diagnosis.
2.10. Sensitivity and uncertainty analysis
We perform one-way sensitivity analysis to determine the parameters that have the biggest influence on the model outcome. This is achieved by changing one parameter at a time while keeping other parameters constant. The parameters of interest are varied between plausible extremes (input values range are described in Tables 4–6). Model outcome (incremental costs per life year gained) for each scenario is then compared against base case to identify the parameters that significantly affect model outcome.
We also conduct probabilistic sensitivity analysis to explore the robustness of model results on all model parameters such as costs of drugs and response rate to precision medicine using Monte Carlo simulation. We assumed lognormal distributions for cost of drugs and sequencing, binomial distributions for the response rates to drugs, and Weibull distributions for the duration of response.
2.11. Weighting
The PeCanMOD assigns weights to individuals to reflect an estimate of childhood cancers within the Australian population. The AIHW published national annual cancer incidence by cancer types and sex via its Australian Cancer Database (Australian Institute of Health and Welfare, 2019a ). Person weight was assigned to each individual in the NSW Central Cancer Registry, controlling for year of diagnosis, sex and cancer types.
2.12. Validation
We carried out internal validation including debugging via code walk through to ensure that the model does not have obvious construction and syntax errors. We also compared model output against external data where available. Model input and output are assessed by paediatric medical oncologist (authors TOB, and TT) for face validity.
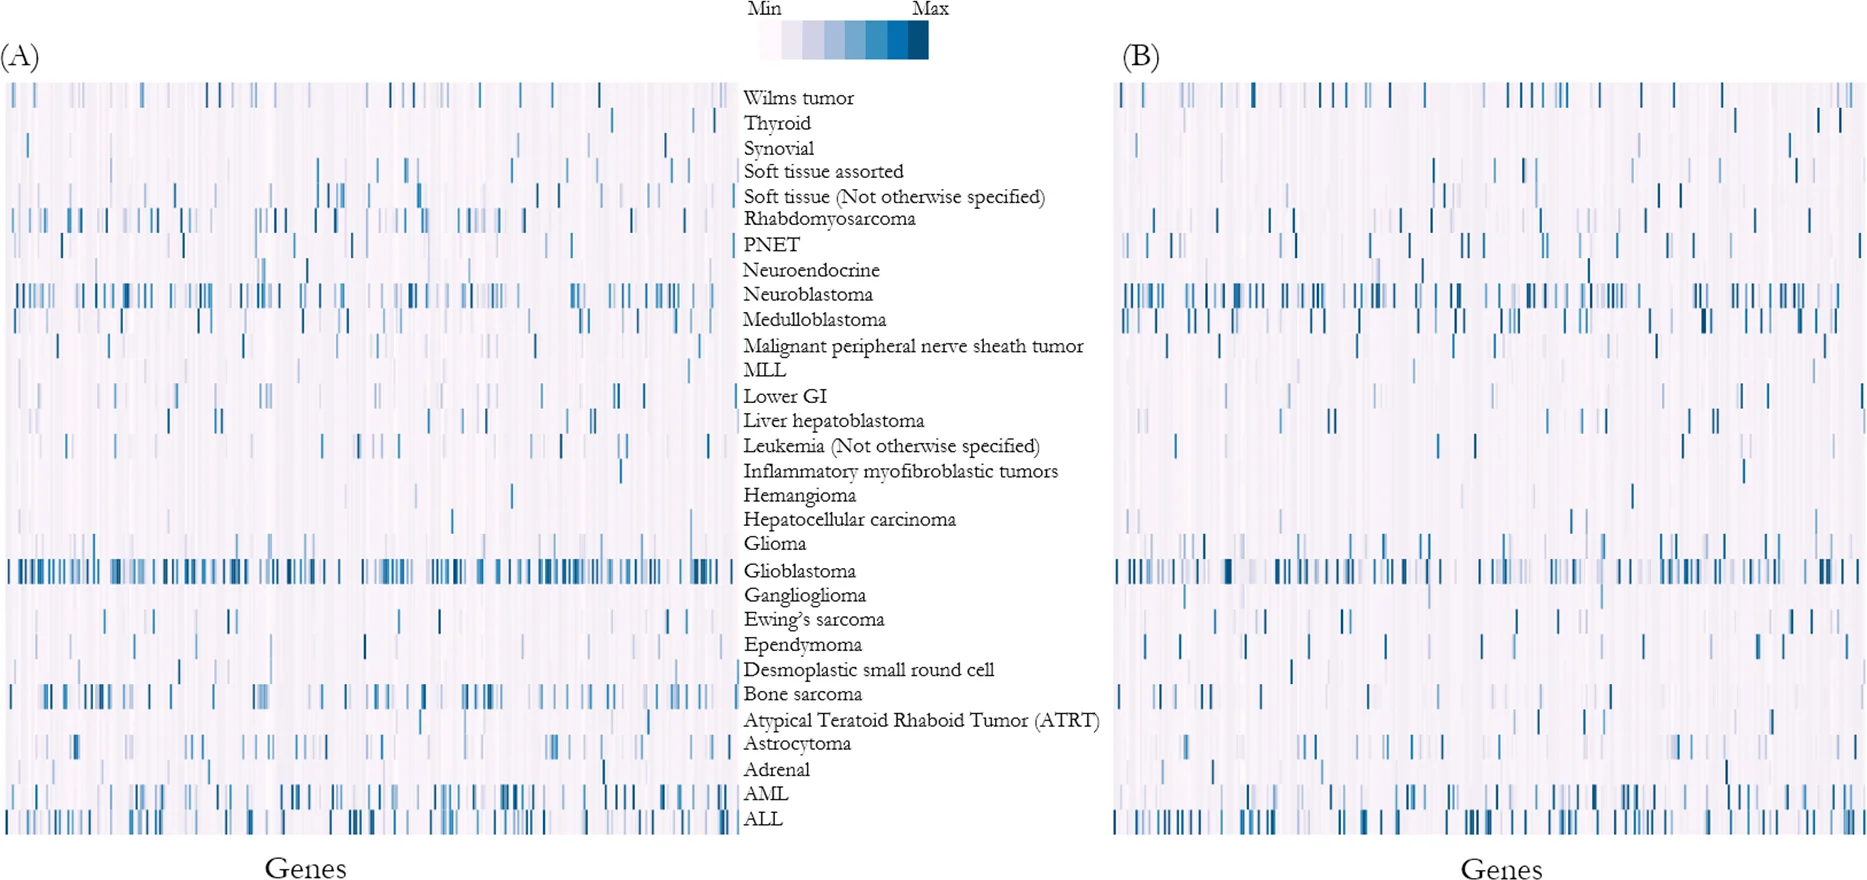
To validate whether the imputed genomic variants distribution is comparable with the Foundation Medicine Pediatric Portal data, we performed Spearman’s rank correlation coefficient analysis and demonstrated that the distribution of genomic variants was significantly correlated between the reference population and NSW Central Cancer Registry simulation output (ρ=0.73, p<0.01) (Figure 3).
2.13. Ethics approval and consent to participate
Human Research Ethics approval has been obtained from the NSW Population & Health Services Research Ethics Committee (HREC/17/CIPHS/7). We have sought permission to waive consent from NSW Ministry of Health under the Health Records and Information Privacy Act 2002 (NSW).
3. Discussion
This paper described the development of a microsimulation model PeCanMOD developed to simulate costs and potential benefits from receiving precision medicine as the last treatment resort for childhood cancer patients. Application of microsimulation model to evaluate cost-effectiveness of intervention in adult cancers was not uncommon, for example, Petelin et al. (2019) modelled cost-effectiveness in a subset of breast and ovarian cancers or Bongers et al modelled cost-effectiveness in non-small-cell lung cancer (Bongers et al., 2016; Petelin et al., 2019). Introduction of precision medicine into children is more recent than for adults. Therefore, there is no microsimulation model for precision medicine in children cancer. Our aim is to fill this knowledge gap through the development of PeCanMOD. The model can be applied in evaluating the cost-effectiveness of multi-drug precision medicine program, and the model output can report the cost-effectiveness of individual drug candidate, and the impact of introducing drug candidate on government’s budget, by taking into account of prevalence of target genomic variants in population of interest.
This study has some limitations. The NSW Admitted Hospital Data Collection dataset is limited to hospital admissions occurred in NSW. Therefore, treatments occurred beyond NSW hospital were not captured. We were unable to account for migration events after patients were diagnosed with cancer as this information were not available in the linked datasets. However, we expect only a very few cases of migration as only ~1.2% of the records did not have matching hospital admission records. The mortality data in our dataset was also limited to only patients that died in NSW due to cancer. Patients died outside of NSW were not recorded in our dataset. In a recent report by NSW Cancer Institute, retrospectively matching NSW Central Cancer Registry data to the National Death Index resulted in 0.16% additional death records (NSW Cancer Institute, 2020). Therefore, we do not expect this limitation to have material impact on the process of identifying patients eligible for precision medicine in our model.
In our model, the treatment protocol is largely based on NCI-COG Pediatric MATCH study. Due to limited evidence of the effectiveness of precision medicine as well as limited understanding of the distribution of actionable variants within the patient population, we have made several assumptions in our current model. To reflect current practice, we modelled that only patients with high-risk cancer or those that have experienced treatment failure to be eligible for precision medicine. However, it is possible that with improvement in technology and clinical implementation, precision medicine can be administered as soon as patients are diagnosed with cancers, and not limited to patients that experiencing treatment failure. The current assumption might introduce heavier weight into certain cancer types as individuals were selected for inclusion in the model based on survival outcomes (post-hoc), which is not feasible in reality.
Due to limited data availability, the model used results from adult trials to simulate drug efficacy in children. In optimal scenario, children are likely to react to medicine just as well as adults, however, it is also possible that they may metabolize certain medicines differently to adults resulting in severe adverse drug reactions and toxicity (Contopoulos-Ioannidis et al., 2010). Extrapolation of the therapeutic benefit from adults to children need to be treated with cautions (Janiaud et al., 2015). Therefore, this model will be continuously updated with new input parameters when relevant clinical trials data are reported.
We were not able to control for other variables, such as sex and age, as these data was not recorded in the Foundation Medicine dataset. Age and sex were significantly associated with cancer risk in this cohort (Stjernfelt et al., 2020), and controlling for age, sex, as well as cancer types, will greatly improve the impute estimates. Furthermore, the Foundation Medicine dataset was not designed to reflect the cancer prevalence in population, with emphasis on cancer types with low 5-year survival. We have imputed genomic variants onto Australian population based on US data, which may not be reflective of genomic diversity of Australian population as disease associated variant might differ across populations (Altshuler et al., 2015; Corona et al., 2013). However, we were unable to ascertain this without evidence from cross-population comparison of the distribution of pathogenic variants responsible for childhood cancer.
Apart from being required to have the appropriate genomic variants, patients also have to meet several other requirements, such as performance status (general well-being of the patients), in order to be eligible for precision medicine trials. In this model, we have simply assumed that all patients having the targetable genomic variants would also meet other eligibility criteria for precision medicine trials. As more clinical trials data becomes available, the model will be updated so that it remains current. As NCI-COG Pediatric MATCH have not yet published their clinical findings, we have used published drug responses in other settings (e.g. adult cancers) as our guide for response rate and survival. Key parameters, including the genomic landscape of paediatric cancer and the effectiveness of precision medicine, are influential in modelled outcomes. With increasingly widespread implementation of genomic sequencing, we will also assume that the cost of genomic analysis will decrease. At present, economic models for precision medicine suffer from the lack of “real world” clinical trial data inputs for the model (Terkola et al., 2017). The design of this model allows flexibility in modelling other treatment protocols, as well as determining the minimum effectiveness or maximum costs of treatment required to achieve cost-effective care. There are several paediatric oncology precision medicine trials ongoing, and health outcome results from these studies are highly anticipated.
However, it is also noteworthy that the majority of ongoing precision medicine clinical trials do not have a matching control population, therefore, modelling the cost-effectiveness of precision medicine programme would rely on counterfactual simulation in silico.
Furthermore, as highlighted in this modelling exercise, understanding the genomic landscape of paediatric cancer patients is crucial in determining the proportion of eligible participants for precision medicine. We believe that a registry created for cancer patients and linking details of the patients’ genomic information would be very useful for future economic evaluation.
Appendix 1
List of genes corresponding to horizontal label in Figure 2 (from left to right).
| ABL1 | ACVR1B | AKT1 | AKT2 | AKT3 | ALK | APC | APCDD1 | AR | ARAF | ARHGAP26 | ARID1A | ARID1B | ARID2 | ASXL1 | ATM | ATR | ATRX | AURKA |
| AURKB | AXIN1 | BAP1 | BARD1 | BCL10 | BCL11B | BCL2 | BCL2A1 | BCL2L2 | BCL6 | BCL7A | BCOR | BCORL1 | BRAF | BRCA1 | BRCA2 | BRD4 | BRIP1 | C17orf39 |
| CARD11 | CASP8 | CBFB | CBL | CCND1 | CCND2 | CCND3 | CCNE1 | CCT6B | CD22 | CD274 | CD36 | CDC73 | CDH1 | CDH2 | CDH20 | CDK12 | CDK4 | CDK6 |
| CDKN1B | CDKN2A | CDKN2B | CDKN2C | CEBPA | CHD2 | CHEK2 | CHUK | CIC | CIITA | CKS1B | CPS1 | CRBN | CREBBP | CRKL | CRLF2 | CSF3R | CTCF | CTNNA1 |
| CTNNB1 | CUX1 | CYLD | DAXX | DDR2 | DDX3X | DICER1 | DIS3 | DNMT3A | DOT1L | EED | EGFR | ELP2 | EP300 | EPHA3 | EPHA5 | EPHA7 | EPHB1 | EPHB4 |
| EPHB6 | ERBB2 | ERBB3 | ERBB4 | ERG | ESR1 | ETS1 | ETV1 | ETV6 | EWSR1 | EZH2 | FAM123B | FAM46C | FANCA | FANCI | FANCM | FAS | FAT1 | FAT3 |
| FBXO11 | FBXW7 | FGF10 | FGF14 | FGF19 | FGF23 | FGF3 | FGF4 | FGF6 | FGFR1 | FGFR2 | FGFR3 | FGFR4 | FLCN | FLT1 | FLT3 | FLT4 | FOXO1 | FOXP1 |
| FUBP1 | FUS | GABRA6 | GATA1 | GATA2 | GATA3 | GATA4 | GLI1 | GNAS | GRIN2A | GRM3 | H3F3A | HDAC4 | HEY1 | HGF | HIST1H1D | HIST1H2AM | HLA | HLA.A |
| HNF1A | HOXA9 | HRAS | ICK | IDH1 | IDH2 | IGF1 | IGF1R | IGF2R | IGH | IKBKE | IKZF1 | IKZF2 | IKZF3 | IL7R | IRF2 | IRF8 | IRS2 | JAK1 |
| JAK2 | JAK3 | JUN | KDM4C | KDM5A | KDM5C | KDM6A | KDR | KEAP1 | KEL | KIT | KRAS | LRP1B | LRRK2 | LZTR1 | MAGI2 | MALT1 | MAP2K1 | MAP2K4 |
| MAP3K1 | MAP3K13 | MAP3K14 | MAP3K6 | MAP3K7 | MAPK1 | MCL1 | MDM2 | MDM4 | MED12 | MEF2C | MEN1 | MET | MKI67 | MLH1 | MLL | MLL2 | MLL3 | MLLT10 |
| MPL | MRE11A | MSH2 | MSH3 | MSH6 | MTOR | MUTYH | MYC | MYCL1 | MYCN | MYH11 | MYST3 | NCOR1 | NCOR2 | NF1 | NF2 | NFE2L2 | NFKBIA | NKX2.1 |
| NOD1 | NOTCH1 | NOTCH2 | NOTCH3 | NOTCH4 | NPM1 | NRAS | NSD1 | NTRK1 | NTRK3 | NUP214 | NUP98 | PALB2 | PARK2 | PASK | PAX3 | PAX5 | PBRM1 | PBX1 |
| PDCD11 | PDCD1LG2 | PDGFB | PDGFRA | PDGFRB | PHF6 | PIK3C2B | PIK3C2G | PIK3CA | PIK3CG | PIK3R1 | PIK3R2 | PLAG1 | PLCG2 | PMS2 | POLE | POT1 | PPP2R1A | PRDM1 |
| PREX2 | PRKCI | PRKDC | PTCH1 | PTEN | PTPN11 | PTPN6 | PTPRD | PTPRO | RAD50 | RAD51 | RAD51C | RAD54L | RAF1 | RANBP2 | RARA | RB1 | REL | RET |
| RICTOR | RNF213 | RNF43 | ROS1 | RPTOR | RUNX1 | RUNX1T1 | SDHA | SDHD | SETBP1 | SETD2 | SF3B1 | SH2B3 | SLIT2 | SMAD4 | SMARCA4 | SMARCB1 | SMARCD1 | SOX10 |
| SOX2 | SPEN | SPTA1 | SRC | SRSF2 | SS18 | STAG2 | STAT4 | STAT6 | STK11 | SUFU | SUZ12 | TAF1 | TAL1 | TBL1XR1 | TBX3 | TCF3 | TERT | TET2 |
| TLL2 | TMEM30A | TNFRSF11A | TNKS | TNKS2 | TP53 | TRRAP | TSC1 | TSC2 | TSHR | TYK2 | U2AF1 | VHL | WHSC1 | WT1 | XPO1 | XRCC2 | ZMYM3 | ZNF217 |
| ZNF703 | ZRSR2 |
Appendix 2
Data linkage methodology
Centre for Health Record Linkage performed the linkage of NSW Cancer Registry, admitted patient data, emergency department data, and Registry of Births, Deaths and Marriages and Cause of Death Unit Record File. Identifying information (name, address, date of birth and sex) for each dataset is included in the Master Linkage Key (MLK) using probabilistic record linkage methods and ChoiceMaker software (Borthwick et al., 2003). At the completion of the linkage process, each record in the MLK was assigned a record identification number and a MLK person ID to allow linked records for the same individual to be identified and extracted.
Once the linkages were completed, the Centre for Health Record Linkage created a Project Person Number (PPN) (also known as linkage ID in the manuscript) for each person identified in the linkage, and assigned this PPN to the corresponding datasets.
Data linkage outcome:
| Datasets | % records linked |
|---|---|
| NSW Central Cancer Registry (base population) | 100 |
| NSW Admitted Patient Data Collection | 98.8 |
| NSW Emergency Department Data Collection | 87.8 |
| Registry of Births, Deaths and Marriages Deaths registry | 18.3 |
| Cause of Death Unit Record File | 17.7 |
References
- Allen, CE, Laetsch, TW, Mody, R, Irwin, MS, Lim, MS, Adamson, PC, Agent Prioritization, C (2017). Target and Agent Prioritization for the Children’s Oncology Group-National Cancer Institute Pediatric MATCH Trial.
- Altshuler, DM, Durbin, RM, Abecasis, GR, Bentley, DR, Chakravarti, A, Clark, AG, Consortium, GP (2015). A global reference for human genetic variation.
- (2019). 2015 Australian cancer database pivot table. Canberra: Australian Institute of health and welfare. http://www.aihw.gov.au/cancer-data.
- (2019). Disease expenditure in Australia. https://www.aihw.gov.au/reports/health-welfare-expenditure/disease-expenditure-australia.
- Bendell, JC, Varghese, AM, Hyman, DM, Bauer, TM, Pant, S, Callies, S, Lin, J, Martinez, R, Wickremsinhe, E, Fink, A, Wacheck, V, Moore, KN (2018). A first-in-human phase 1 study of LY3023414, an oral PI3K/mTOR dual inhibitor, in patients with advanced cancer. Clinical Cancer Research, 24, 3253–3262. https://doi.org/10.1158/1078-0432.CCR-17-3421
- Bongers, ML, de Ruysscher, D, Oberije, C, Lambin, P, Uyl-de Groot, CA, Coupé, VMH (2016). Multistate statistical modeling: A tool to build a lung cancer Microsimulation model that includes parameter uncertainty and patient heterogeneity. Medical decision making : an international journal of the Society for Medical Decision Making, 36, 86–100. https://doi.org/10.1177/0272989X15574500
- Borthwick, A (2003). Key concepts in the ChoiceMaker 2 record matching system.
- Cancer Institute, NSW (2018). NSW cancer registry. https://www.cancer.nsw.gov.au/data-research/data-held-by-cinsw/nsw-cancer-registry.
- (2018). How record linkage works. http://www.cherel.org.au/how-record-linkage-works.
- Chang, W, Brohl, AS, Patidar, R, Sindiri, S, Shern, JF, Wei, JS, Song, YK, Yohe, ME, Gryder, B, Zhang, S, Calzone, KA, Shivaprasad, N, Wen, X, Badgett, TC, Miettinen, M, Hartman, KR, League-Pascual, JC, Trahair, TN, Widemann, BC, Merchant, MS, Kaplan, RN, Lin, JC, Khan, J (2016). Multidimensional ClinOmics for precision therapy of children and adolescent young adults with relapsed and refractory cancer: A report from the center for cancer research. Clinical Cancer Research, 22, 3810–3820. https://doi.org/10.1158/1078-0432.CCR-15-2717
- Chmielecki, J, Bailey, M, He, J, Elvin, J, Vergilio, JA, Ramkissoon, S, Lipson, D (2016). Genomic profiling of 1239 diverse pediatric cancers identifies novel discoveries across tumors.
- Chmielecki, J, Bailey, M, He, J, Elvin, J, Vergilio, J-A, Ramkissoon, S, Suh, J, Frampton, GM, Sun, JX, Morley, S, Spritz, D, Ali, S, Gay, L, Erlich, RL, Ross, JS, Buxhaku, J, Davies, H, Faso, V, Germain, A, Glanville, B, Miller, VA, Stephens, PJ, Janeway, KA, Maris, JM, Meshinchi, S, Pugh, TJ, Shern, JF, Lipson, D (2017). Genomic profiling of a large set of diverse pediatric cancers identifies known and novel mutations across tumor spectra. Cancer Research, 77, 509–519. https://doi.org/10.1158/0008-5472.CAN-16-1106
- Contopoulos-Ioannidis, DG, Baltogianni, MS, Ioannidis, JPA (2010). Comparative effectiveness of medical interventions in adults versus children. The Journal of Pediatrics, 157. https://doi.org/10.1016/j.jpeds.2010.02.011
- Cools, J (2012). Improvements in the survival of children and adolescents with acute lymphoblastic leukemia. Haematologica, 97. https://doi.org/10.3324/haematol.2012.068361
- Corona, E, Chen, R, Sikora, M, Morgan, AA, Patel, CJ, Ramesh, A, Bustamante, CD, Butte, AJ (2013). Analysis of the genetic basis of disease in the context of worldwide human relationships and migration. PLoS Genetics, 9. https://doi.org/10.1371/journal.pgen.1003447
- (2018). HIGHLIGHTS OF PRESCRIBING INFORMATION-VITRAKVI® (larotrectinib). https://www.accessdata.fda.gov/drugsatfda_docs/label/2018/210861s000lbl.pdf.
- (2019). HIGHLIGHTS OF PRESCRIBING INFORMATION-BALVERSA (erdafitinib). https://www.accessdata.fda.gov/drugsatfda_docs/label/2019/212018s000lbl.pdf.
- Forrest, SJ, Geoerger, B, Janeway, KA (2018). Precision medicine in pediatric oncology. Current Opinion in Pediatrics, 30, 17–24. https://doi.org/10.1097/MOP.0000000000000570
- (2019). The global burden of childhood and adolescent cancer in 2017: An analysis of the global burden of disease study 2017. The Lancet Oncology, 20, 1211–1225. https://doi.org/10.1016/S1470-2045(19)30339-0
- (2018). Global Burden of Disease Study 2017 (GBD 2017) Disability Weights. Retrieved from Seattle, United States.
- Golan, T, Hammel, P, Reni, M, Van Cutsem, E, Macarulla, T, Hall, MJ, Park, J-O, Hochhauser, D, Arnold, D, Oh, D-Y, Reinacher-Schick, A, Tortora, G, Algül, H, O’Reilly, EM, McGuinness, D, Cui, KY, Schlienger, K, Locker, GY, Kindler, HL (2019). Maintenance Olaparib for Germline BRCA -Mutated Metastatic Pancreatic Cancer. New England Journal of Medicine, 381, 317–327. https://doi.org/10.1056/NEJMoa1903387
- Gordon, LG, White, NM, Elliott, TM, Nones, K, Beckhouse, AG, Rodriguez-Acevedo, AJ, Webb, PM, Lee, XJ, Graves, N, Schofield, DJ (2020). Estimating the costs of genomic sequencing in cancer control. BMC Health Services Research, 20. https://doi.org/10.1186/s12913-020-05318-y
- Gröbner, SN, Worst, BC, Weischenfeldt, J, Buchhalter, I, Kleinheinz, K, Rudneva, VA, Johann, PD, Balasubramanian, GP, Segura-Wang, M, Brabetz, S, Bender, S, Hutter, B, Sturm, D, Pfaff, E, Hübschmann, D, Zipprich, G, Heinold, M, Eils, J, Lawerenz, C, Erkek, S, Lambo, S, Waszak, S, Blattmann, C, Borkhardt, A, Kuhlen, M, Eggert, A, Fulda, S, Gessler, M, Wegert, J, Kappler, R, Baumhoer, D, Burdach, S, Kirschner-Schwabe, R, Kontny, U, Kulozik, AE, Lohmann, D, Hettmer, S, Eckert, C, Bielack, S, Nathrath, M, Niemeyer, C, Richter, GH, Schulte, J, Siebert, R, Westermann, F, Molenaar, JJ, Vassal, G, Witt, H, Burkhardt, B, Kratz, CP, Witt, O, van Tilburg, CM, Kramm, CM, Fleischhack, G, Dirksen, U, Rutkowski, S, Frühwald, M, von Hoff, K, Wolf, S, Klingebiel, T, Koscielniak, E, Landgraf, P, Koster, J, Resnick, AC, Zhang, J, Liu, Y, Zhou, X, Waanders, AJ, Zwijnenburg, DA, Raman, P, Brors, B, Weber, UD, Northcott, PA, Pajtler, KW, Kool, M, Piro, RM, Korbel, JO, Schlesner, M, Eils, R, Jones, DTW, Lichter, P, Chavez, L, Zapatka, M, Pfister, SM, , (2018). The landscape of genomic alterations across childhood cancers. Nature, 555, 321–327. https://doi.org/10.1038/nature25480
- Hamblin, A, Wordsworth, S, Fermont, JM, Page, S, Kaur, K, Camps, C, Kaisaki, P, Gupta, A, Talbot, D, Middleton, M, Henderson, S, Cutts, A, Vavoulis, DV, Housby, N, Tomlinson, I, Taylor, JC, Schuh, A (2017). Clinical applicability and cost of a 46-gene panel for genomic analysis of solid tumours: retrospective validation and prospective audit in the UK National health service. PLOS Medicine, 14. https://doi.org/10.1371/journal.pmed.1002230
- Harttrampf, AC, Lacroix, L, Deloger, M, Deschamps, F, Puget, S, Auger, N, Vielh, P, Varlet, P, Balogh, Z, Abbou, S, Allorant, A, Valteau-Couanet, D, Sarnacki, S, Gamiche-Rolland, L, Meurice, G, Minard-Colin, V, Grill, J, Brugieres, L, Dufour, C, Gaspar, N, Michiels, S, Vassal, G, Soria, J-C, Geoerger, B (2017). Molecular screening for cancer treatment optimization (MOSCATO-01) in pediatric patients: A single-institutional prospective molecular stratification trial. Clinical Cancer Research, 23, 6101–6112. https://doi.org/10.1158/1078-0432.CCR-17-0381
- Herper, M (2018). Loxo And Bayer’s Amazing Drug Has An Expensive Price. https://www.forbes.com/sites/matthewherper/2018/11/26/loxo-and-bayers-amazing-drug-has-an-expensive-price/#28d56924d0c7.
- Horn, L, Reckamp, KL, Patel, S, Blumenschein, G, Neal, JW, Gitlitz, B, Wakelee, HA (2017). CNS activity of ensartinib in ALK-positive non-small cell lung cancer patients.
- Hyman, DM, Puzanov, I, Subbiah, V, Faris, JE, Chau, I, Blay, J-Y, Wolf, J, Raje, NS, Diamond, EL, Hollebecque, A, Gervais, R, Elez-Fernandez, ME, Italiano, A, Hofheinz, R-D, Hidalgo, M, Chan, E, Schuler, M, Lasserre, SF, Makrutzki, M, Sirzen, F, Veronese, ML, Tabernero, J, Baselga, J (2015). Vemurafenib in multiple nonmelanoma cancers with BRAF V600 mutations. New England Journal of Medicine, 373, 726–736. https://doi.org/10.1056/NEJMoa1502309
- Italiano, A, Soria, J-C, Toulmonde, M, Michot, J-M, Lucchesi, C, Varga, A, Coindre, J-M, Blakemore, SJ, Clawson, A, Suttle, B, McDonald, AA, Woodruff, M, Ribich, S, Hedrick, E, Keilhack, H, Thomson, B, Owa, T, Copeland, RA, Ho, PTC, Ribrag, V (2018). Tazemetostat, an EZH2 inhibitor, in relapsed or refractory B-cell non-Hodgkin lymphoma and advanced solid tumours: A first-in-human, open-label, phase 1 study. The Lancet Oncology, 19, 649–659. https://doi.org/10.1016/S1470-2045(18)30145-1
- Jain, N, Curran, E, Iyengar, NM, Diaz-Flores, E, Kunnavakkam, R, Popplewell, L, Kirschbaum, MH, Karrison, T, Erba, HP, Green, M, Poire, X, Koval, G, Shannon, K, Reddy, PL, Joseph, L, Atallah, EL, Dy, P, Thomas, SP, Smith, SE, Doyle, LA, Stadler, WM, Larson, RA, Stock, W, Odenike, O (2014). Phase II study of the oral MEK inhibitor selumetinib in advanced acute myelogenous leukemia: A university of Chicago phase II Consortium trial. Clinical Cancer Research, 20, 490–498. https://doi.org/10.1158/1078-0432.CCR-13-1311
- Janiaud, P, Lajoinie, A, Cour-Andlauer, F, Cornu, C, Cochat, P, Cucherat, M, Gueyffier, F, Kassai, B (2015). Different treatment benefits were estimated by clinical trials performed in adults compared with those performed in children. Journal of Clinical Epidemiology, 68, 1221–1231. https://doi.org/10.1016/j.jclinepi.2015.06.021
- Joseph, PD, Craig, JC, Caldwell, PHY (2015). Clinical trials in children. British Journal of Clinical Pharmacology, 79, 357–369. https://doi.org/10.1111/bcp.12305
- Khater, F, Vairy, S, Langlois, S, Dumoucel, S, Sontag, T, St-Onge, P, Bittencourt, H, Dal Soglio, D, Champagne, J, Duval, M, Leclerc, J-M, Laverdiere, C, Tran, TH, Patey, N, Ellezam, B, Perreault, S, Piché, N, Samson, Y, Teira, P, Jabado, N, Michon, B, Brossard, J, Marzouki, M, Cellot, S, Sinnett, D (2019). Molecular profiling of Hard-to-Treat childhood and adolescent cancers. JAMA Network Open, 2. https://doi.org/10.1001/jamanetworkopen.2019.2906
- Kwon, J, Kim, SW, Ungar, WJ, Tsiplova, K, Madan, J, Petrou, S (2018). A systematic review and meta-analysis of childhood health utilities. Medical Decision Making, 38, 277–305. https://doi.org/10.1177/0272989X17732990
- Ma, X, Liu, Y, Liu, Y, Alexandrov, LB, Edmonson, MN, Gawad, C, Zhou, X, Li, Y, Rusch, MC, Easton, J, Huether, R, Gonzalez-Pena, V, Wilkinson, MR, Hermida, LC, Davis, S, Sioson, E, Pounds, S, Cao, X, Ries, RE, Wang, Z, Chen, X, Dong, L, Diskin, SJ, Smith, MA, Guidry Auvil, JM, Meltzer, PS, Lau, CC, Perlman, EJ, Maris, JM, Meshinchi, S, Hunger, SP, Gerhard, DS, Zhang, J (2018). Pan-Cancer genome and transcriptome analyses of 1,699 paediatric leukaemias and solid tumours. Nature, 555, 371–376. https://doi.org/10.1038/nature25795
- McShane, TM, Wolfe, TA, Ryan, JC (2018). Updates on managing advanced breast cancer with palbociclib combination therapy. Therapeutic Advances in Medical Oncology, 10. https://doi.org/10.1177/1758835918793849
- Mody, RJ, Wu, Y-M, Lonigro, RJ, Cao, X, Roychowdhury, S, Vats, P, Frank, KM, Prensner, JR, Asangani, I, Palanisamy, N, Dillman, JR, Rabah, RM, Kunju, LP, Everett, J, Raymond, VM, Ning, Y, Su, F, Wang, R, Stoffel, EM, Innis, JW, Roberts, JS, Robertson, PL, Yanik, G, Chamdin, A, Connelly, JA, Choi, S, Harris, AC, Kitko, C, Rao, RJ, Levine, JE, Castle, VP, Hutchinson, RJ, Talpaz, M, Robinson, DR, Chinnaiyan, AM (2015). Integrative clinical sequencing in the management of refractory or relapsed cancer in youth. JAMA, 314, 913–925. https://doi.org/10.1001/jama.2015.10080
- (2020). Changes to the NSW cancer incidence and mortality dataset for 2017 release . https://www.cancer.nsw.gov.au/getmedia/12181726-95bd-4bf4-8b1b-ec454580ef97/E20-24816-Changes-for-NSWCR-2017-CIM-release-Nov2020.pdf.
- Pagliarulo, N (2019). J&J wins FDA OK for first targeted therapy in bladder cancer. https://www.biopharmadive.com/news/jj-wins-fda-ok-for-first-targeted-therapy-in-bladder-cancer/552666/.
- Petelin, L, Hossack, L, Mitchell, G, Liew, D, Trainer, AH, James, PA (2019). A Microsimulation model for evaluating the effectiveness of cancer risk management for BRCA pathogenic variant carriers: miBRovaCAre. Value in Health, 22, 854–862. https://doi.org/10.1016/j.jval.2019.03.008
- (2019). Olaparib. https://www.pbs.gov.au/medicine/item/11034R-11050N.
- (2019). Palbociclib. https://www.pbs.gov.au/medicine/item/11698Q-11699R-11700T.
- (2019). Vemurafenib. https://www.pbs.gov.au/medicine/item/11076Y-11081F.
- Pritchard-Jones, K, Pieters, R, Reaman, GH, Hjorth, L, Downie, P, Calaminus, G, Naafs-Wilstra, MC, Steliarova-Foucher, E (2013). Sustaining innovation and improvement in the treatment of childhood cancer: Lessons from high-income countries. The Lancet Oncology, 14, e95–e103. https://doi.org/10.1016/S1470-2045(13)70010-X
- Rehm, HL (2017). Evolving health care through personal genomics. Nature Reviews Genetics, 18, 259–267. https://doi.org/10.1038/nrg.2016.162
- Rusch, M, Nakitandwe, J, Shurtleff, S, Newman, S, Zhang, Z, Edmonson, MN, Parker, M, Jiao, Y, Ma, X, Liu, Y, Gu, J, Walsh, MF, Becksfort, J, Thrasher, A, Li, Y, McMurry, J, Hedlund, E, Patel, A, Easton, J, Yergeau, D, Vadodaria, B, Tatevossian, RG, Raimondi, S, Hedges, D, Chen, X, Hagiwara, K, McGee, R, Robinson, GW, Klco, JM, Gruber, TA, Ellison, DW, Downing, JR, Zhang, J (2018). Clinical cancer genomic profiling by three-platform sequencing of whole genome, whole exome and transcriptome. Nature Communications, 9. https://doi.org/10.1038/s41467-018-06485-7
- Rutter, CM, Zaslavsky, AM, Feuer, EJ (2011). Dynamic microsimulation models for health outcomes: A review. Medical Decision Making, 31, 10–18. https://doi.org/10.1177/0272989X10369005
- Schofield, DJ, Zeppel, MJB, Tan, O, Lymer, S, Cunich, MM, Shrestha, RN (2018). A brief, global history of Microsimulation models in health: Past applications, lessons learned and future directions. International Journal of Microsimulation, 11, 97–142. https://doi.org/10.34196/ijm.00175
- Schwarze, K, Buchanan, J, Fermont, JM, Dreau, H, Tilley, MW, Taylor, JM, Antoniou, P, Knight, SJL, Camps, C, Pentony, MM, Kvikstad, EM, Harris, S, Popitsch, N, Pagnamenta, AT, Schuh, A, Taylor, JC, Wordsworth, S (2020). The complete costs of genome sequencing: A microcosting study in cancer and rare diseases from a single center in the United Kingdom. Genetics in Medicine, 22, 85–94. https://doi.org/10.1038/s41436-019-0618-7
- Schwarze, K, Buchanan, J, Taylor, JC, Wordsworth, S (2018). Are whole-exome and whole-genome sequencing approaches cost-effective? A systematic review of the literature. Genetics in Medicine, 20, 1122–1130. https://doi.org/10.1038/gim.2017.247
- Seibel, NL, Janeway, K, Allen, CE, Chi, SN, Cho, Y-J, Glade Bender, JL, Kim, A, Laetsch, TW, Irwin, MS, Takebe, N, Tricoli, JV, Parsons, DW (2017). Pediatric oncology enters an era of precision medicine. Current Problems in Cancer, 41, 194–200. https://doi.org/10.1016/j.currproblcancer.2017.01.002
- Smith, MA, Altekruse, SF, Adamson, PC, Reaman, GH, Seibel, NL (2014). Declining childhood and adolescent cancer mortality. Cancer, 120, 2497–2506. https://doi.org/10.1002/cncr.28748
- Stjernfelt, K-J, von Stedingk, K, Wiebe, T, Hjorth, L, Kristoffersson, U, Stenmark-Askmalm, M, Olsson, H, Øra, I (2020). Increased cancer risk in families with pediatric cancer is associated with gender, age, diagnosis, and degree of relation to the child. Cancer Epidemiology Biomarkers & Prevention, 29, 2171–2179. https://doi.org/10.1158/1055-9965.EPI-20-0322
- Subbiah, V, Rodon, J, Yap, TA (2018). Precision oncology: East meets West. International Journal of Cancer, 142, 1734–1737. https://doi.org/10.1002/ijc.31218
- Sullivan, RJ, Infante, JR, Janku, F, Wong, DJL, Sosman, JA, Keedy, V, Patel, MR, Shapiro, GI, Mier, JW, Tolcher, AW, Wang-Gillam, A, Sznol, M, Flaherty, K, Buchbinder, E, Carvajal, RD, Varghese, AM, Lacouture, ME, Ribas, A, Patel, SP, DeCrescenzo, GA, Emery, CM, Groover, AL, Saha, S, Varterasian, M, Welsch, DJ, Hyman, DM, Li, BT (2018). First-In-Class ERK1/2 inhibitor Ulixertinib (BVD-523) in patients with MAPK mutant advanced solid tumors: Results of a phase I dose-escalation and expansion study. Cancer Discovery, 8, 184–195. https://doi.org/10.1158/2159-8290.CD-17-1119
- Sweet-Cordero, EA, Biegel, JA (2019). The genomic landscape of pediatric cancers: implications for diagnosis and treatment. Science, 363, 1170–1175. https://doi.org/10.1126/science.aaw3535
- Tan, O, Shrestha, R, Cunich, M, Schofield, DJ (2018). Application of next-generation sequencing to improve cancer management: A review of the clinical effectiveness and cost-effectiveness. Clinical Genetics, 93, 533–544. https://doi.org/10.1111/cge.13199
- Tarride, J-E, Burke, N, Bischof, M, Hopkins, RB, Goeree, L, Campbell, K, Xie, F, O'Reilly, D, Goeree, R (2010). A review of health utilities across conditions common in paediatric and adult populations. Health and Quality of Life Outcomes, 8. https://doi.org/10.1186/1477-7525-8-12
- Terkola, R, Antoñanzas, F, Postma, M (2017). Economic evaluation of personalized medicine: A call for real-world data. The European Journal of Health Economics, 18, 1065–1067. https://doi.org/10.1007/s10198-017-0890-x
- Tran, TH, Shah, AT, Loh, ML (2017). Precision medicine in pediatric oncology: Translating genomic discoveries into optimized therapies. Clinical Cancer Research, 23, 5329–5338. https://doi.org/10.1158/1078-0432.CCR-16-0115
- Turnbull, C (2018). Introducing whole-genome sequencing into routine cancer care: The Genomics England 100 000 Genomes Project. Annals of Oncology, 29, 784–787. https://doi.org/10.1093/annonc/mdy054
- van Amerongen, RA, Retèl, VP, Coupé, VM, Nederlof, PM, Vogel, MJ, van Harten, WH (2016). Next-Generation sequencing in NSCLC and melanoma patients: A cost and budget impact analysis. Ecancermedicalscience, 10. https://doi.org/10.3332/ecancer.2016.684
- Vis, DJ, Lewin, J, Liao, RG, Mao, M, Andre, F, Ward, RL, Calvo, F, Teh, BT, Camargo, AA, Knoppers, BM, Sawyers, CL, Wessels, LFA, Lawler, M, Siu, LL, Voest, E, (2017). Towards a global cancer knowledge network: Dissecting the current International cancer genomic sequencing landscape. Annals of Oncology, 28, 1145–1151. https://doi.org/10.1093/annonc/mdx037
- Weymann, D, Dragojlovic, N, Pollard, S, Regier, DA (2019). Allocating healthcare resources to genomic testing in Canada: Latest evidence and current challenges. Journal of Community Genetics, 1–10. https://doi.org/10.1007/s12687-019-00428-5
- Weymann, D, Laskin, J, Roscoe, R, Schrader, KA, Chia, S, Yip, S, Cheung, WY, Gelmon, KA, Karsan, A, Renouf, DJ, Marra, M, Regier, DA (2017). The cost and cost trajectory of whole-genome analysis guiding treatment of patients with advanced cancers. Molecular Genetics & Genomic Medicine, 5, 251–260. https://doi.org/10.1002/mgg3.281
- Wong, M, Mayoh, C, Lau, LMS, Khuong-Quang, D-A, Pinese, M, Kumar, A, Barahona, P, Wilkie, EE, Sullivan, P, Bowen-James, R, Syed, M, Martincorena, I, Abascal, F, Sherstyuk, A, Bolanos, NA, Baber, J, Priestley, P, Dolman, MEM, Fleuren, EDG, Gauthier, M-E, Mould, EVA, Gayevskiy, V, Gifford, AJ, Grebert-Wade, D, Strong, PA, Manouvrier, E, Warby, M, Thomas, DM, Kirk, J, Tucker, K, O'Brien, T, Alvaro, F, McCowage, GB, Dalla-Pozza, L, Gottardo, NG, Tapp, H, Wood, P, Khaw, S-L, Hansford, JR, Moore, AS, Norris, MD, Trahair, TN, Lock, RB, Tyrrell, V, Haber, M, Marshall, GM, Ziegler, DS, Ekert, PG, Cowley, MJ (2020). Whole genome, transcriptome and methylome profiling enhances actionable target discovery in high-risk pediatric cancer. Nature Medicine, 26, 1742–1753. https://doi.org/10.1038/s41591-020-1072-4
- Worst, BC, van Tilburg, CM, Balasubramanian, GP, Fiesel, P, Witt, R, Freitag, A, Boudalil, M, Previti, C, Wolf, S, Schmidt, S, Chotewutmontri, S, Bewerunge-Hudler, M, Schick, M, Schlesner, M, Hutter, B, Taylor, L, Borst, T, Sutter, C, Bartram, CR, Milde, T, Pfaff, E, Kulozik, AE, von Stackelberg, A, Meisel, R, Borkhardt, A, Reinhardt, D, Klusmann, J-H, Fleischhack, G, Tippelt, S, Dirksen, U, Jürgens, H, Kramm, CM, von Bueren, AO, Westermann, F, Fischer, M, Burkhardt, B, Wößmann, W, Nathrath, M, Bielack, SS, Frühwald, MC, Fulda, S, Klingebiel, T, Koscielniak, E, Schwab, M, Tremmel, R, Driever, PH, Schulte, JH, Brors, B, von Deimling, A, Lichter, P, Eggert, A, Capper, D, Pfister, SM, Jones, DTW, Witt, O (2016). Next-generation personalised medicine for high-risk paediatric cancer patients - The INFORM pilot study. European Journal of Cancer, 65, 91–101. https://doi.org/10.1016/j.ejca.2016.06.009
- Yeh, JM, Hanmer, J, Ward, ZJ, Leisenring, WM, Armstrong, GT, Hudson, MM, Stovall, M, Robison, LL, Oeffinger, KC, Diller, L (2016). Chronic conditions and Utility-Based health-related quality of life in adult childhood cancer survivors. Journal of the National Cancer Institute, 108. https://doi.org/10.1093/jnci/djw046
- Yu, TM, Morrison, C, Gold, EJ, Tradonsky, A, Arnold, RJG (2018). Budget impact of next-generation sequencing for molecular assessment of advanced non-small cell lung cancer. Value in Health, 21, 1278–1285. https://doi.org/10.1016/j.jval.2018.04.1372
Article and author information
Author details
Funding
No specific funding for this article is reported.
Acknowledgements
We thank the Cancer Institute NSW, and the NSW Ministry of Health for access to the health data, the NSW Registry of Births Deaths and Marriages for providing access to mortality data, and the NSW Centre for Health Record Linkage for conducting record linkage. The Cause of Death Unit Record File (Cause of Death Unit Record File) is provided by the NSW Registry of Births, Deaths, and Marriages, NSW Coroner and the National Coronial Information System.
This research is supported by an Australian Government Research Training Program (RTP) Scholarship.
Publication history
Copyright
© 2021, Tan et al.
This article is distributed under the terms of the Creative Commons Attribution License, which permits unrestricted use and redistribution provided that the original author and source are credited.