
Jump to
1. Introduction
On top of the health crisis, the coronavirus pandemic has also led to severe economic hardship via lost earnings and increased joblessness. In the case of South Africa, the NIDS-CRAM telephonic survey has provided up-to-date information on the labour market and other social impacts of COVID-19,1 including hunger. However, the impact of the pandemic on poverty and inequality at the household level is a topic for which prior evidence has not been readily available.
The purpose of this paper is to examine the impacts of the first wave of the coronavirus pandemic during the second quarter of 2020 on poverty and inequality in South Africa. This timepoint refers to the first wave of COVID-19 in the country and when a nation-wide lockdown took place. The main objective of our analysis is to investigate how well the social protection system in South Africa was able to mitigate the economic losses to the public. We take into account both the existing benefit system, which was in place before the crisis, and the influence of the new policy measures introduced in 2020 to help people cope with the crisis.
To study these issues, we use a tax–benefit microsimulation approach. This methodology has been used in many other countries (see, for example, Brewer and Tasseva, 2020; Jara et al., 2021) to examine the impacts of the crisis on households’ disposable income, as well as poverty and inequality. Tax–benefit microsimulation models combine a representative survey of incomes and other socioeconomic characteristics of the population with a modelling of tax and benefit rules, and they are used to examine the impact of tax–benefit policies on household welfare.
SAMOD, a tax–benefit microsimulation model for South Africa,2 is used in this study in the following way: first, the database underpinning the model is updated to reflect the demographic situation that was in place just before the crisis—that is, the situation in March 2020.3 Second, the dataset is adjusted for the labour market characteristics that existed at the height of the crisis during the second quarter of 2020. This is achieved by predicting the labour market situation (whether a person became unemployed or furloughed or lost part of their income) on the basis of the information in the NIDS-CRAM dataset, where a subset of the people who are represented in the dataset underpinning SAMOD were asked about their situation during the crisis.4 Third, the new benefits that were introduced in 2020 to provide households with relief during the crisis are introduced into the model. The model is then used to examine the extent to which incomes declined during the crisis, how large a share of the decline was avoided due to the social protection offered by the government, and the resulting impact on poverty and inequality. The results help to understand the success of the social protection system in mitigating the economic consequences of the crisis. They also provide pointers towards further improvements to the benefit system.
This paper is organized as follows. Section 2 describes how COVID-19 hit South Africa, including its consequences for employment. Section 3 contains a summary of the government’s policy response, detailing the new social benefits that were introduced in 2020. Section 4 reports the results of the study, while Section 5 concludes.
2. Labour market impacts of COVID-19 during the first lockdown
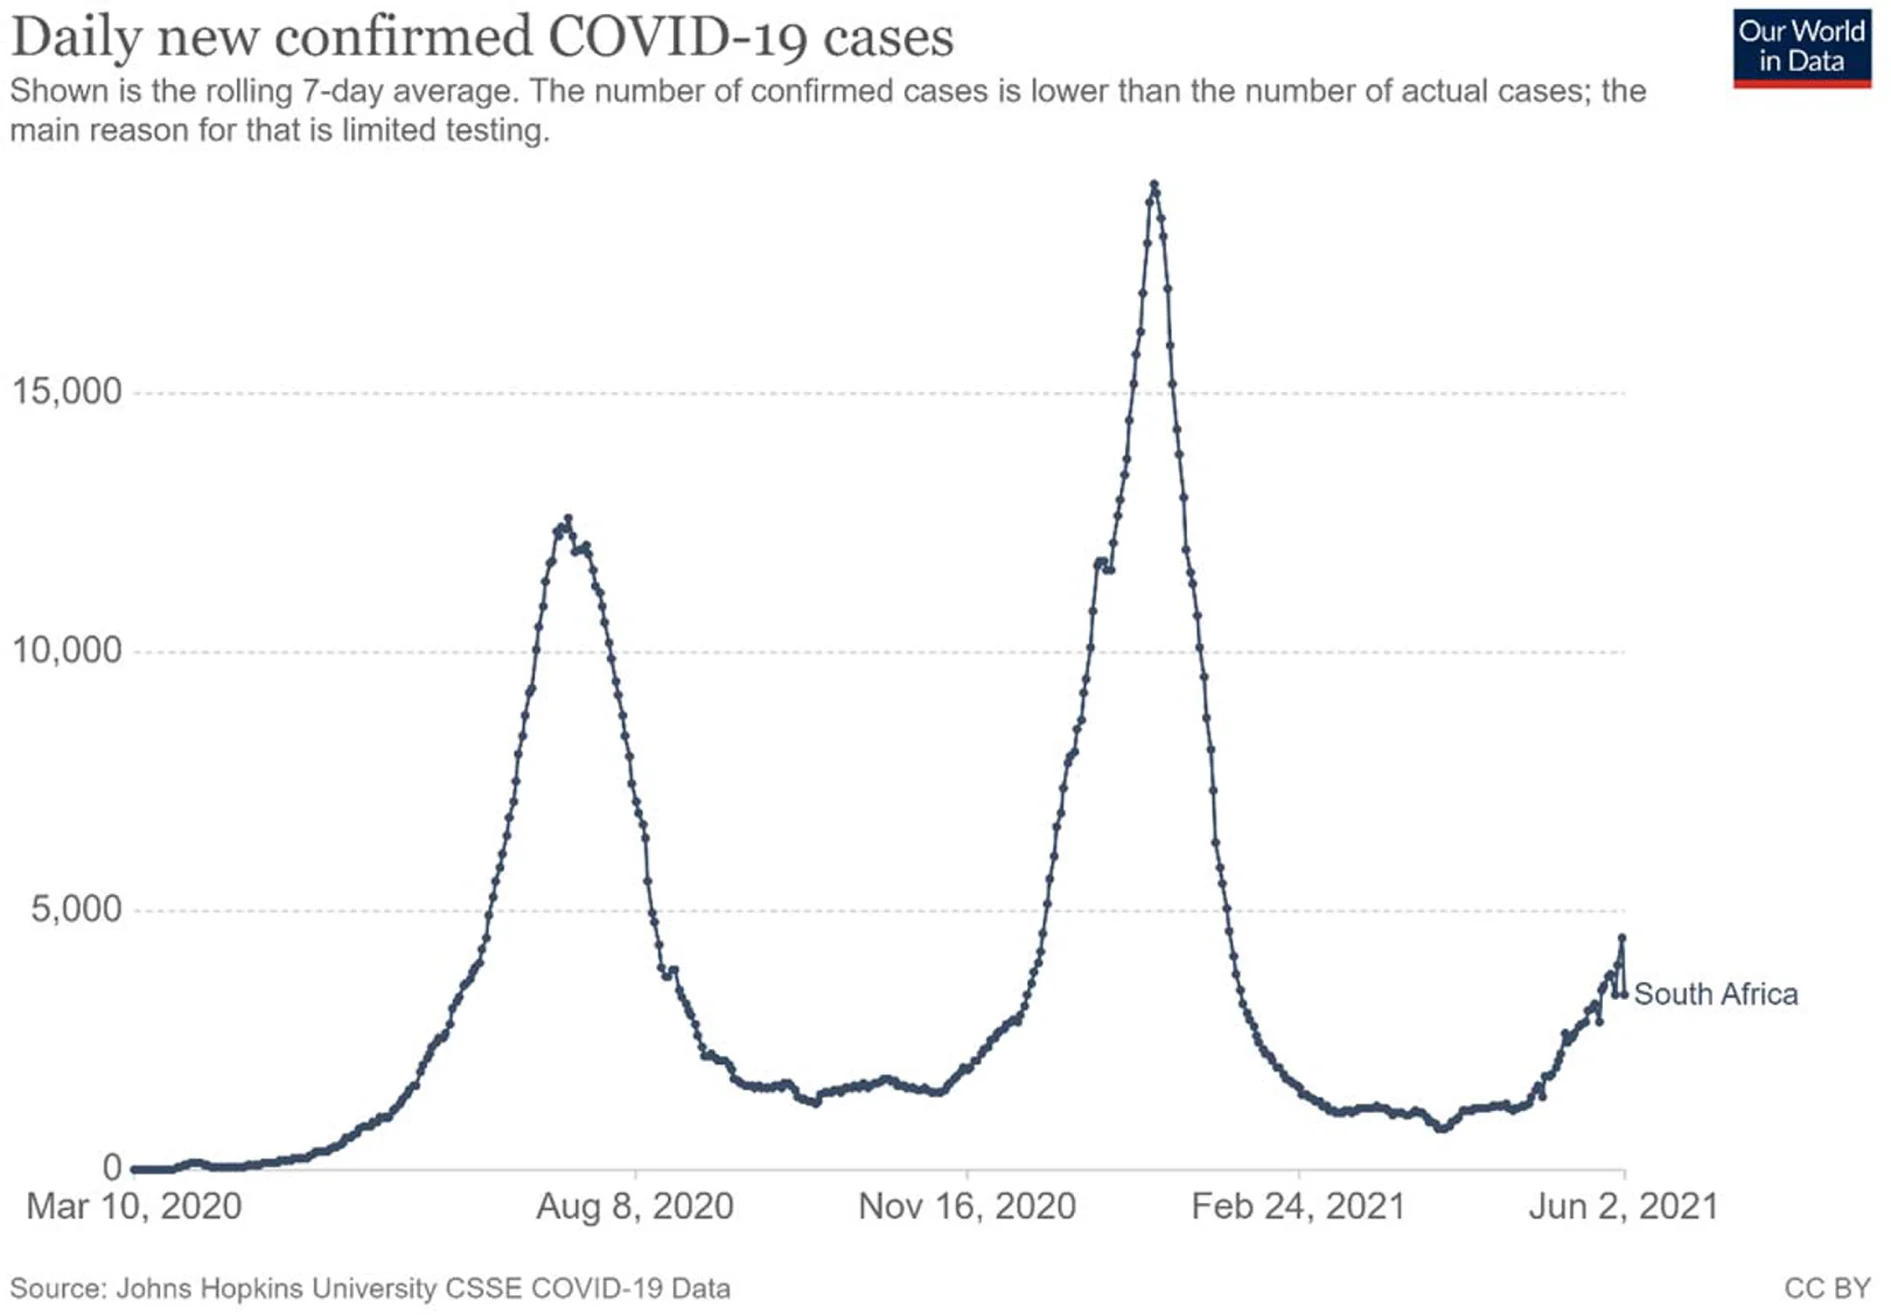
The first wave of COVID-19 in South Africa began in March 2020 and peaked in June 2020 (Figure 1). The second wave occurred between November 2020 and February 2021, with the third wave starting in June 2021. In late March 2020, a lockdown of the country took effect, which banned all but vital outside movement, closed down many public spaces (such as schools and shops not selling essential goods), and included, for example, a ban on alcohol sales. The most stringent lockdown was in place until the end of April 2020. Under these conditions the majority of industries were closed down, and people other than essential workers were not allowed to leave their homes to work. Clearly this meant that the South African labour market was severely affected in the first half of 2020.
Some surveys provide insight into the labour market effects of the crisis over our study period (March – June 2020). NIDS-CRAM is a broadly representative national panel survey implemented using computer-assisted telephone interviewing (CATI) that focuses on adult individuals’ responses to the pandemic and lockdown. The first wave of interviews was conducted across May and June and collected retrospective employment information for April (during the strictest period of lockdown – level 5) and February (before the COVID-19 shock) (see Jain et al., 2020). The other significant source of information on the employment shock comes from the second-quarter round of the Quarterly Labour Force Survey (QLFS) (Statistics South Africa, 2020). The inability to conduct interviews during the pandemic meant that the release of the second quarter of the survey was delayed and that the survey had to be changed to be run telephonically.
Both the QLFS and NIDS-CRAM revealed dramatic losses of employment at the height of the national lockdown (estimates of around 2.2 million and close to 3 million jobs lost, respectively). Further, research from NIDS-CRAM showed that this job loss was found to be especially severe among women (Casale and Posel, 2020), the youth, and lower-income workers (Ranchhod and Daniels, 2020).5 The employment effects were also more serious for informal workers (Rogan and Skinner, 2020), who were prohibited from working or trading and simultaneously excluded from some of the social support measures introduced in response to the crisis. In addition to this large-scale loss of employment, there was also an unprecedented increase in the number of workers who became furloughed, working zero hours and earning no pay, and in the number of workers who were placed on paid leave (Jain et al., 2020), and many workers faced reduced earnings.
3. Policy responses in 2020
South Africa has a well-established tax and benefit system that was already in place prior to the pandemic. This meant that it was possible for the government to make swift changes to the existing arrangements to mitigate the effect of the pandemic on people’s incomes. In addition, new policies were introduced to support groups that were not covered by existing policies.
Table 1 lists the tax and benefit policies that are simulated in SAMOD, most of which existed prior to the pandemic (see column 2). The pandemic was declared a national disaster on 15 March 2020 and a national lockdown was announced on 23 March 2020. One of the first policy responses to be introduced, on 26 March, was an adjustment to the Unemployment Insurance Fund (UIF), with the establishment of the COVID-19 Temporary Employer/Employee Relief Scheme (TERS) (Republic of South Africa, 2020). TERS was payable by application of employers to the Department of Labour on behalf of their furloughed workers who were unable to go to work due to the lockdown but who had not been made redundant. In some cases the earnings of these employees were suspended, while in other cases their salaries were reduced. The TERS payment is calculated on a sliding scale, ranging from R3,500 to R6,500 per month.
| Tax–benefit policy | Existed prior to COVID-19? | Changes introduced due to COVID-19? | Summary of the changes that were introduced due to COVID-19, if applicable |
|---|---|---|---|
| Old Age Grant (OAG) | ✓ | ✓ | OAG top-up of R250 in May–October 2020 inclusive |
| Disability Grant (DG) | ✓ | ✓ | DG top-up of R250 in May–October 2020 inclusive |
| Child Support Grant | ✓ | ✓ | CSG top-up of R300 per child for May 2020 only |
| Care Dependency Grant (CDG) | ✓ | ✓ | CDG top-up of R250 in May–October 2020 inclusive |
| Foster Child Grant (FCG) | ✓ | ✓ | FCG top-up of R250 in May–October2020 inclusive |
| Caregiver Social Relief of Distress (Caregiver-SRD) | X | ✓ New | A payment of R500 was made to each CSG caregiver (irrespective of number of children) for June–October 2020 inclusive |
| COVID-19 Social Relief of Distress (COVID-SRD) | X | ✓ New | COVID-19 SRD payment of R350 from May 2020 to end of April 2021 |
| Personal income tax main policy | ✓ | ✓ But not implemented in SAMOD | A proportion of PAYE (paid to the South African Revenue Service by employers) could be deferred. Tax relief was also introduced for provisional tax (for the self-employed, individuals running their own small businesses with gross income below R100 million). |
| Income tax rebates | ✓ | X | N/A |
| Income tax on lump sums | ✓ | X | N/A |
| Medical tax credits | ✓ | X | N/A |
| Unemployment Insurance Fund contributions | ✓ | X | N/A |
| Temporary Employer/Employee Relief Scheme | X | ✓ New | UIF introduced TERS (or ‘COVID UIF’) payments for furloughed employees in April 2020, which had a minimum payment of R3,500 per month (even if usual salary is less than this) up to R6,500 per month on a sliding scale. |
Source: Authors’ compilation.
Note: The Skills Development Levy and the Employment Tax Incentive are not modelled in SAMOD as these concern employers rather than employees. Grant-in-aid and the War Veterans Grant are not simulated due to lack of information in the input dataset with which to model the policy. UIF contributions are simulated in SAMOD but receipt of the main UIF benefits is not modelled due to lack of data on past contributions. CSG was also increased from 1 October 2020 by R10 to R450.
With respect to the social benefits, four were amended to be paid at a higher level for May through to October 2020: the payments for the Old Age Grant, Disability Grant, Foster Child Grant, and Care Dependency Grant were each increased in value by R250 per month. As the payment systems for these grants were already in place, it was technically straightforward to implement these top-up payments.
The Child Support Grant (CSG) was initially amended in a similar way, with the value of the CSG being increased by R300 per month in May. However, this was then removed and replaced by a dedicated benefit for the primary caregivers of children in low-income families: each primary caregiver in receipt of CSG for their child(ren) became eligible for a new benefit, called the Caregiver Social Relief of Distress (Caregiver-SRD), which was paid at R500 per month for May through to October 2020. As with the other grants, the CSG payment system was already in place and it was technically straightforward for the 7.1 million primary caregivers to receive the Caregiver-SRD for themselves in addition to the CSG for their children. This was a particularly important policy change because when the CSG was first introduced in 1998 to replace the former State Maintenance Grant (SMG), the caregiver component of the SMG was not carried through to the CSG, leaving caregivers of working age with no social assistance unless they were disabled.6
Another significant response was the introduction of a new benefit called the COVID Social Relief of Distress (COVID-SRD), which was paid at R350 per person per month to people of working age who were unemployed and had no income.7 This was a more difficult group to get on to the payment system and its roll-out was therefore slower than for the other grants mentioned above. Nevertheless, it was set up at great speed and has been iteratively extended in duration (its current end date is the end of April 2021). Again, this was an important policy change as prior to the pandemic there had been no social assistance in South Africa for unemployed people of working age unless they were disabled, apart from the short-term Social Relief of Distress, used sparingly in exceptional circumstances such as natural disasters or incarceration of one’s spouse.
All of these policy adjustments and innovations were simulated in SAMOD for the relevant months and are referred to here as ‘the COVID-19 policies’. As this study focuses on March, April, May, and June 2020, the COVID-19 policies can be summarized as comprising TERS (applied in April, May, and June), benefit increases (in May and June with the exception of the CSG increase, which was only in May), and new benefits (COVID-SRD in May and June; Caregiver-SRD in June).8
Within SAMOD, a separate system (set of tax and benefit rules) was prepared for each of the four months March to June 2020, and in such a way that the COVID-19 policies could be either included or excluded in the running of the model. This enables one to estimate the extent to which poverty and inequality were affected by the lockdown in a scenario that includes all of the actual policies that were in place in each month, and in a hypothetical scenario with no COVID-19 policies.
Lastly, an important consideration when modelling the policy responses is the extent to which the simulations of the policies reflect actual receipt of the benefits and insurance payments in practice. The two main discrepancies that were identified are summarized here:
SAMOD simulates more than twice the number of recipients of the COVID-SRD benefit for May and June than received it in practice. This is likely to be due to implementation challenges associated with the sudden roll-out of a new benefit. For this reason, a switch was added in SAMOD that enables the user to dampen receipt of the COVID-SRD to reflect actual numbers of beneficiaries in May and June, as reported by the South African Social Security Agency. This enables one to compare a situation in which all eligible recipients receive the benefit (the ‘de jure’ scenario), with the actual (or ‘de facto’) scenario.
In contrast, SAMOD simulated many fewer recipients of TERS than received the benefit in practice: 44, 60, and 64 per cent of the actual number of recipients in April, May, and June, respectively (Department of Employment and Labour, 2020). A decision was made not to adjust for this under-simulation, on the basis that it can be assumed that a subset of those who reported earnings in NIDS-CRAM Wave 1 were actually reporting income derived from TERS.9 As a consequence, the findings about the impact of the COVID-19 policies will be understated with respect to the role of TERS; however, it should not affect results on the combined impact of the shock and all policies on distributional incomes as the income sources are not differentiated.
4. Results
This section presents the main findings from the study. Results are provided with respect to changes in disposable income, poverty, and inequality, and the extent to which the COVID-19 policies helped protect household incomes and provide additional support for those already in poverty during the first few months of the pandemic.
As described in Appendix C, the labour market shock induced by the pandemic and lockdown was incorporated in the simulation by modelling loss of employment and earnings among those who were employed going into the lockdown (using predictions based on NIDS-CRAM Wave 1). This modelling reflects predicted outcomes at the height of the crisis and lockdown (in April), and remains static throughout all of the months considered here (up to June). This means that these results can be interpreted as a counterfactual showing what poverty and distributional outcomes would have been had these different policy regimes (from different months) been in place at the height of the lockdown.
4.1. Change in mean disposable income between March and June 2020
Figure 2 shows the distribution of household per capita disposable income by decile for March, April, May, and June 2020, in rands. Disposable income refers to incomes after the deduction of simulated personal income tax payments and UIF contributions, and having added all relevant simulated benefits. The deciles are deciles of disposable income for March 2020, and are held constant for the other three months.
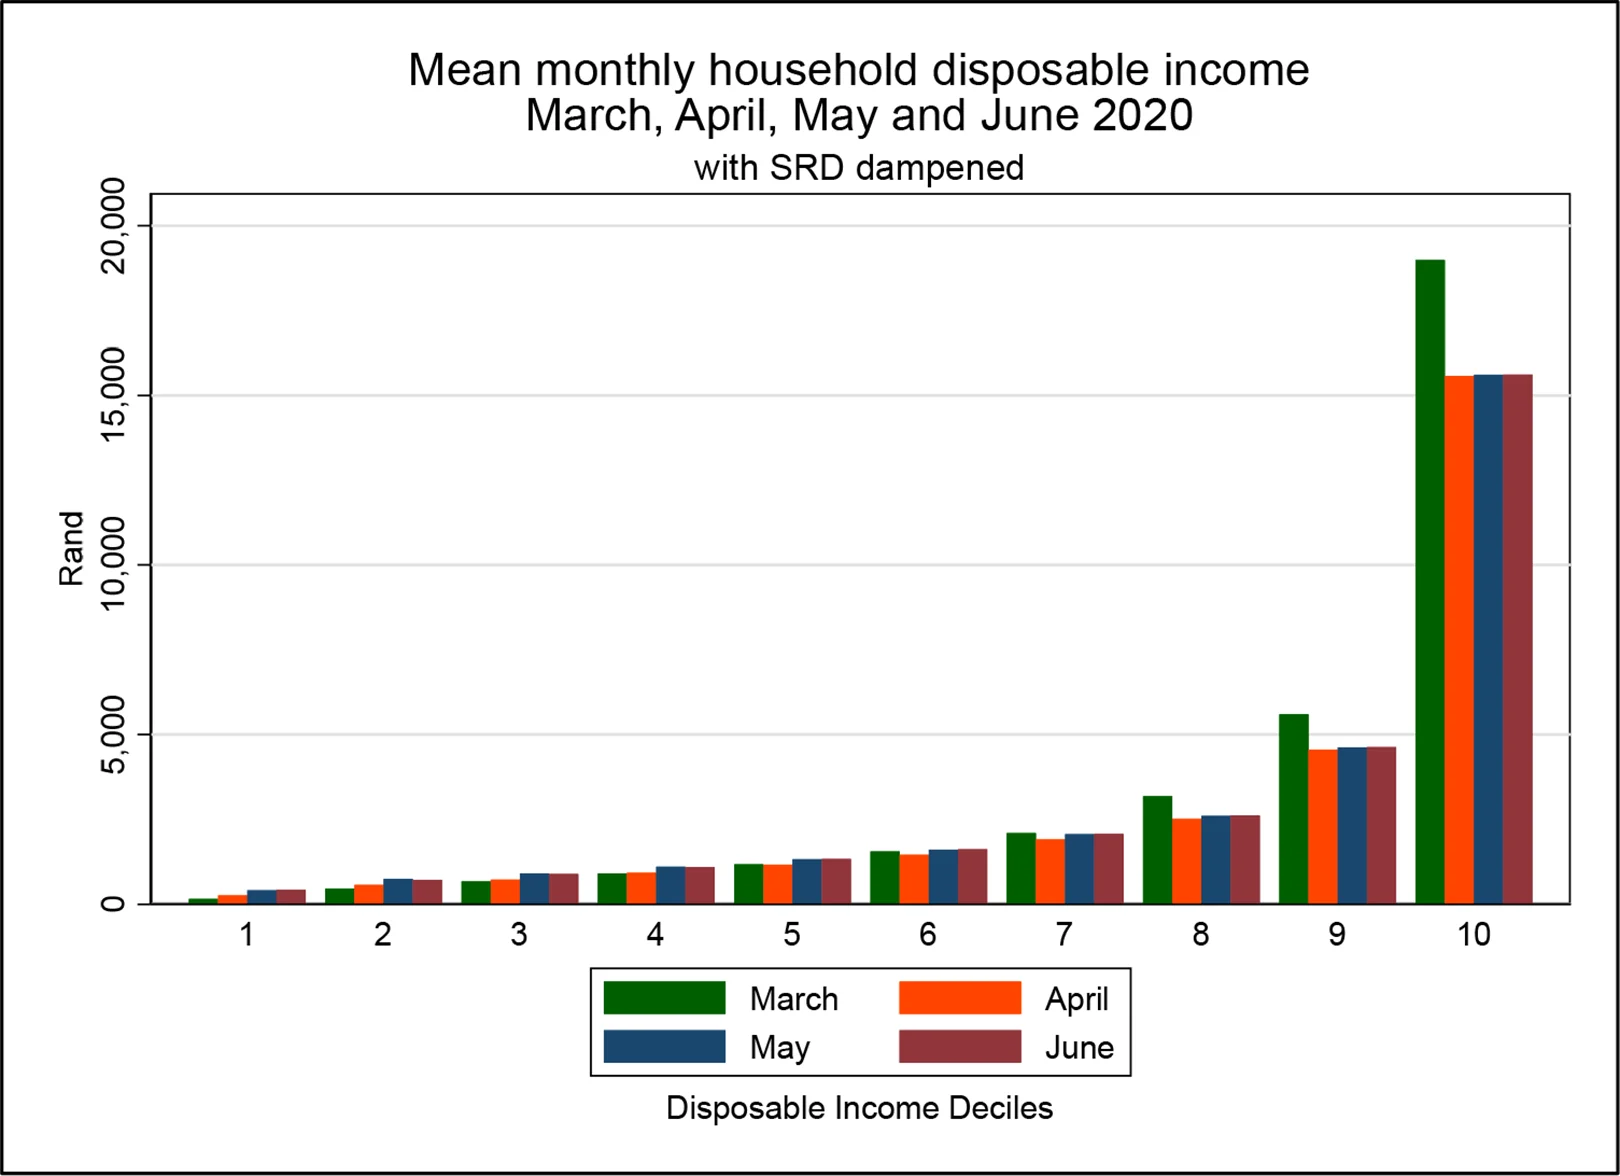
Mean disposable income fell for the wealthier deciles and ultimately increased for the poorer deciles. The first column in each decile (in green) shows the situation in March 2020 prior to the shock, while the results for the other three months are based on the shocked input dataset in which those in employment prior to the shock had been assigned different statuses. Here, the most notable change is the reduction in mean monthly household disposable incomes in the top (richest) deciles.
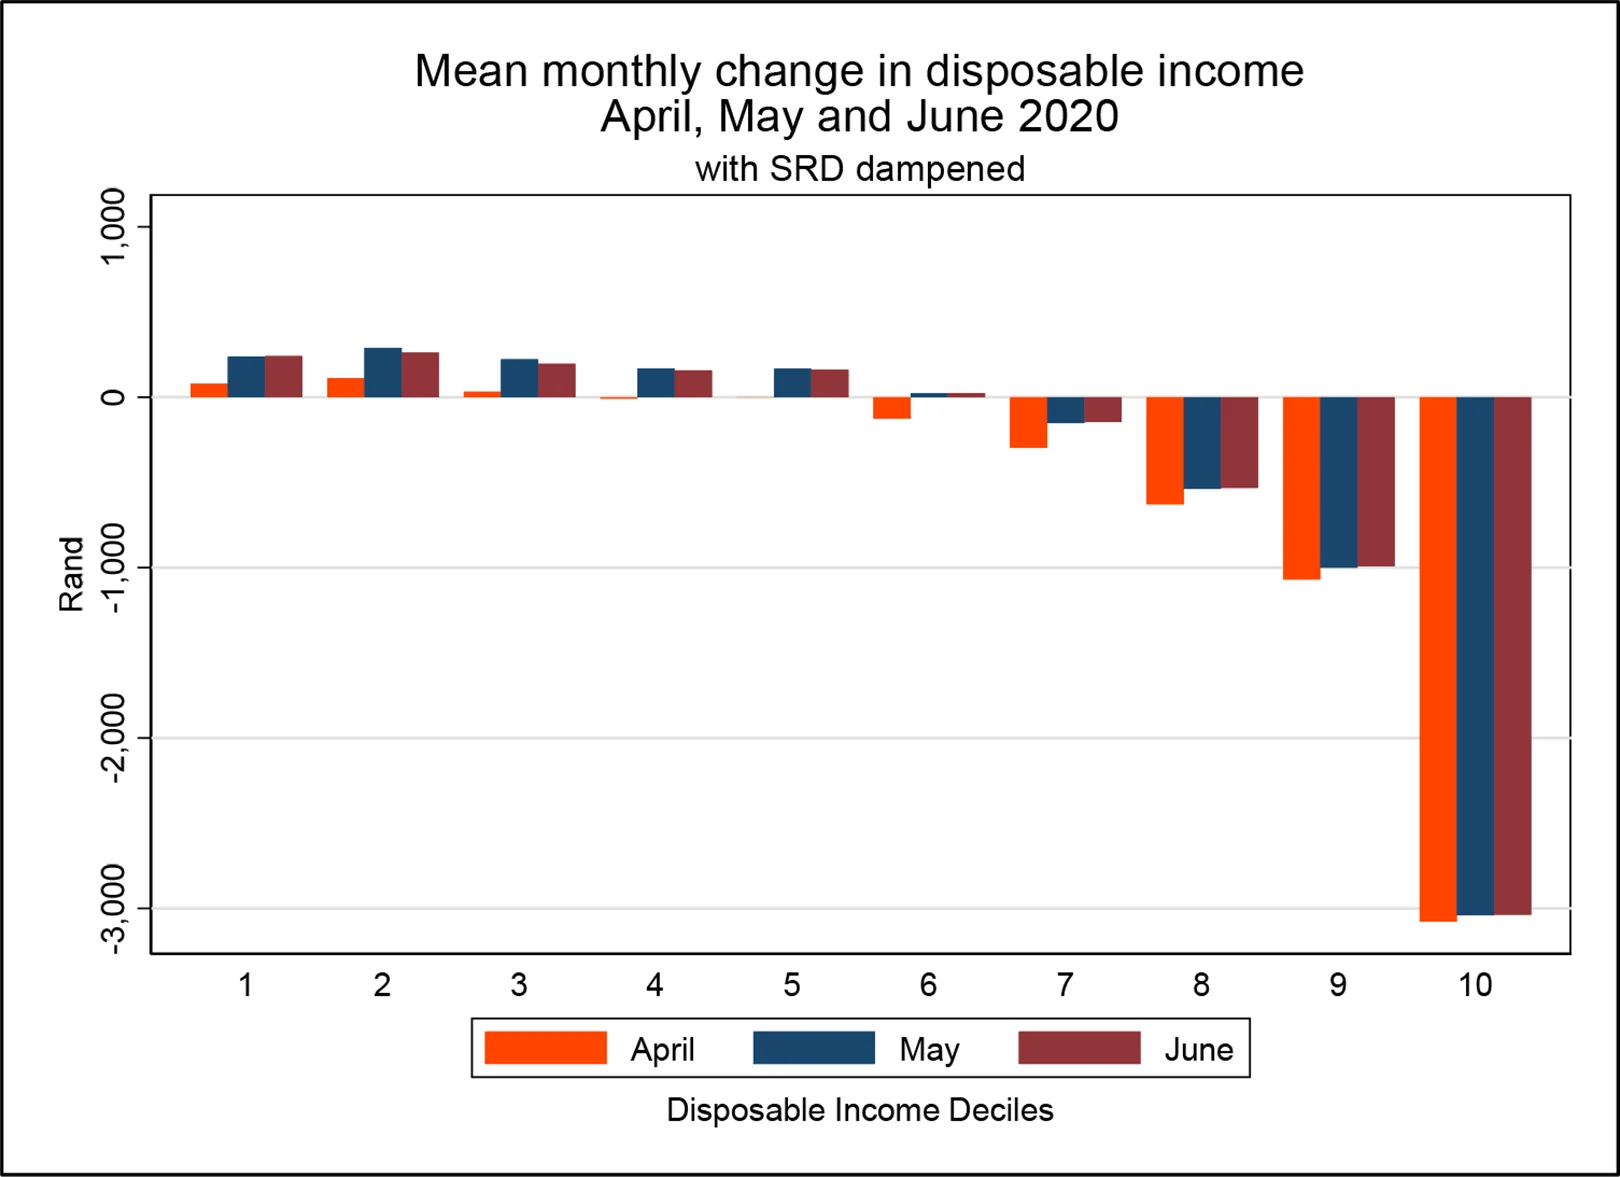
Figure 3 shows the change in mean monthly household disposable income by decile in rands. As can be seen, deciles 7–10 experienced a fall in disposable income in April, May, and June when compared with the baseline in March. The wealthiest (tenth) decile experienced the largest fall in disposable income. In contrast, in May and June deciles 1–6 experienced a rise in disposable income.
The increase in disposable income in the lower deciles that is observed in Figure 3 is small in rand amounts, but when expressed as a percentage of March’s mean disposable incomes the change is more striking. This is shown in Figure 4, which shows that the mean disposable income of those in the first (poorest) decile increased by just over 100 per cent in April and by almost 200 per cent in May and June compared to March. As will be elaborated below, the notable increases for the lower deciles are a result of the introduction of social assistance for people of working age.
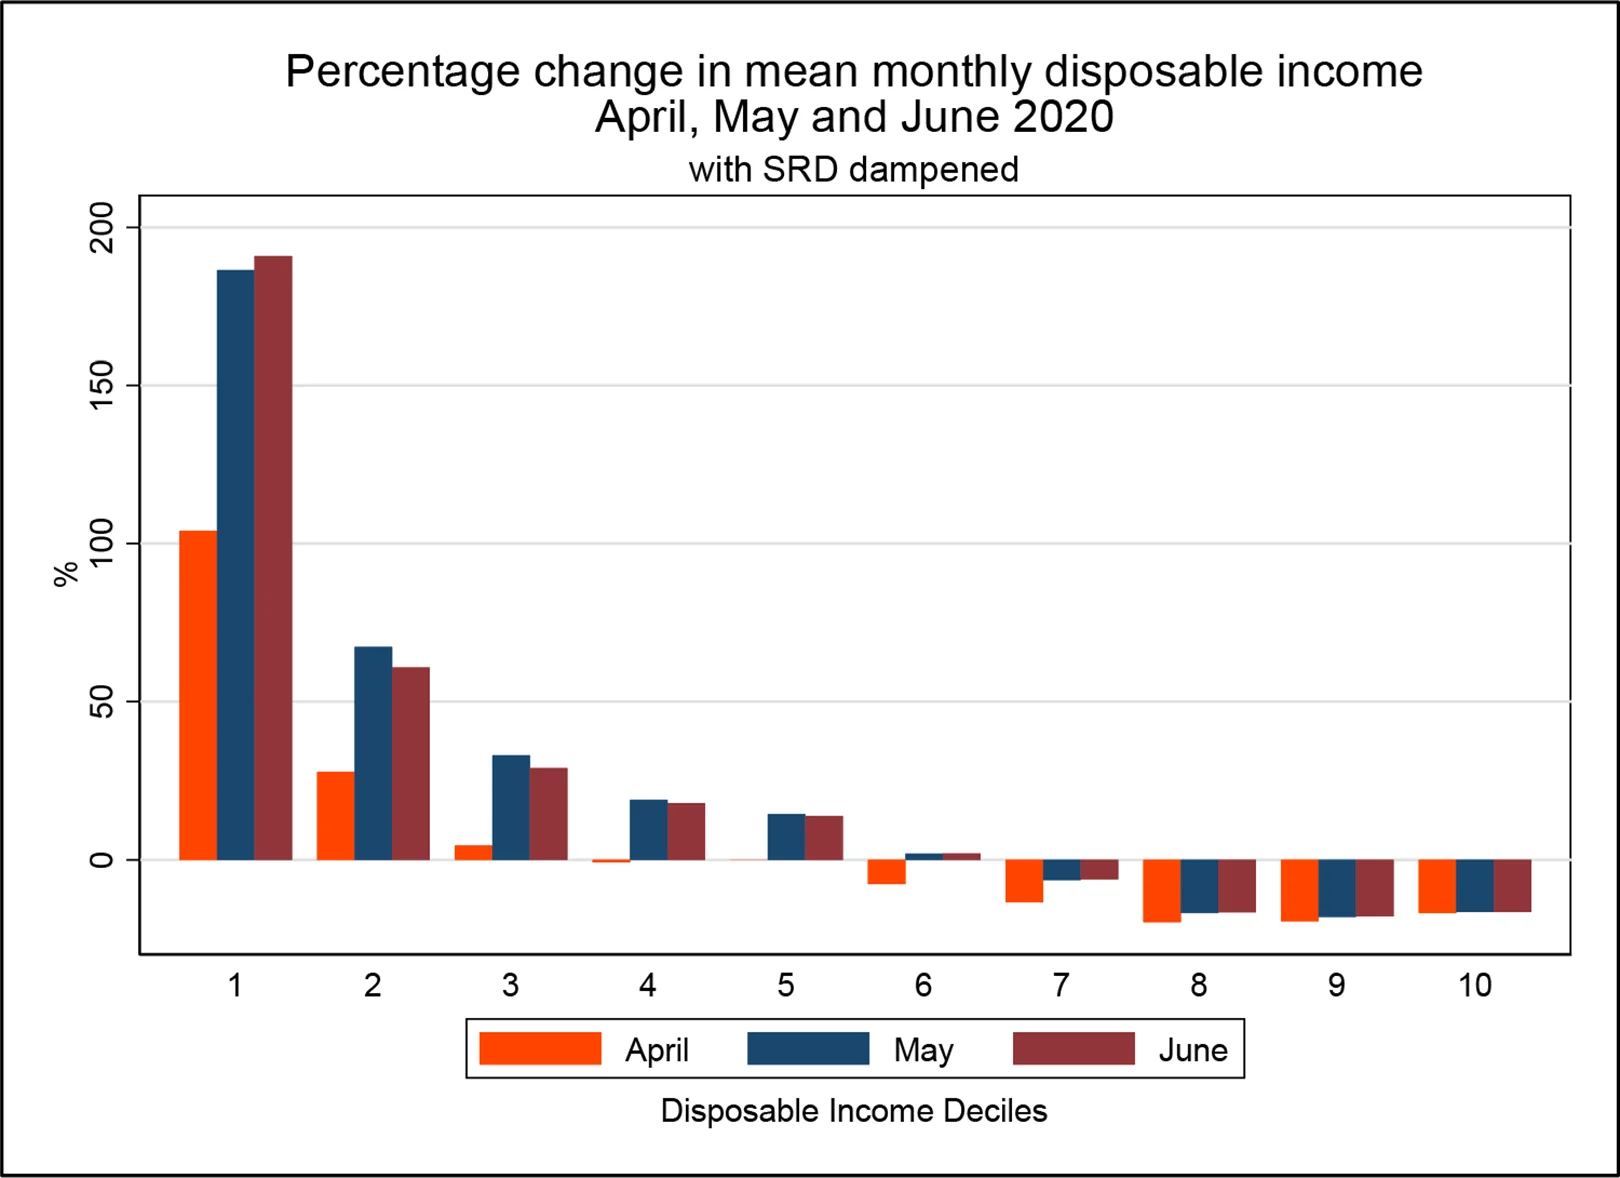
Although the wealthiest (tenth decile) loses the most in absolute terms, the eighth and ninth deciles lose slightly more in relative terms.
4.2. Change in income poverty and inequality between March and June 2020
Table 2 shows how the poverty rates changed across the four time points, using Statistics South Africa’s three poverty lines. It should be recalled that the input dataset for April, May, and June is held constant in the simulations and so the only drivers of any changes are the simulated policy responses to the pandemic and associated lockdown.
| Poverty line | Scenario | March | April | May | June | |
|---|---|---|---|---|---|---|
| FPL | Existing policies (COVID-SRD dampened) | P0 | 0.206 | 0.263 | 0.209 | 0.188 |
| P1 | 0.091 | 0.129 | 0.083 | 0.070 | ||
| Existing policies (COVID-SRD not dampened) | P0 | N/A | N/A | 0.164 | 0.177 | |
| P1 | N/A | N/A | 0.047 | 0.049 | ||
| All policies apart from COVID-19 policies | P0 | N/A | 0.321 | 0.321 | 0.321 | |
| P1 | N/A | 0.158 | 0.158 | 0.158 | ||
| LBPL | Existing policies (COVID-SRD dampened) | P0 | 0.326 | 0.379 | 0.343 | 0.307 |
| P1 | 0.145 | 0.188 | 0.143 | 0.123 | ||
| Existing policies (COVID-SRD not dampened) | P0 | N/A | N/A | 0.276 | 0.291 | |
| P1 | N/A | N/A | 0.099 | 0.105 | ||
| All policies apart from COVID-19 policies | P0 | N/A | 0.452 | 0.452 | 0.452 | |
| P1 | N/A | 0.229 | 0.229 | 0.229 | ||
| UBPL | Existing policies (COVID-SRD dampened) | P0 | 0.482 | 0.525 | 0.527 | 0.475 |
| P1 | 0.233 | 0.278 | 0.245 | 0.215 | ||
| Existing policies (COVID-SRD not dampened) | P0 | N/A | N/A | 0.461 | 0.468 | |
| P1 | N/A | N/A | 0.192 | 0.199 | ||
| All policies apart from COVID-19 policies | P0 | N/A | 0.593 | 0.593 | 0.593 | |
| P1 | N/A | 0.329 | 0.329 | 0.329 |
Source: Authors’ analysis of output datasets from SAMOD V7.3-COVID.
Note: FPL, food poverty line (R561 in April 2019 rands); LBPL, lower-bound poverty line (R810 in April 2019 rands); UBPL, upper-bound poverty line (R1,227 in April 2019 rands). Simulated receipt of COVID-SRD benefit was dampened to match actual receipt (applicable to May and June only). The poverty lines were inflated from April 2019 rands to March, April, May, and June 2020 rands using the consumer price index and then averaged.
For each of the three poverty lines, the first row shows the poverty headcount ratio with all policies switched on (that is, taking into account both the set of policies that existed prior to the pandemic and the set of policies that were introduced as COVID-19 policies to mitigate the impact of the pandemic), but with receipt of the COVID-SRD benefit dampened to match reported numbers of beneficiaries. Using all three poverty lines, poverty is higher in April and May when compared to March. Poverty reached its height in April when only the TERS had been introduced and no changes had been made to the benefit system. For example, using the food poverty line, poverty rose from 0.206 in March to 0.263 in April, at which point over one-quarter of people in South Africa were below the food poverty line.
Notably for all three poverty lines, in June poverty fell to a level lower than in March. This is reflected in the poverty headcount and the poverty depth summary measure (Table 2). The two policy differences between May and June were the switch from CSG top-up payments to a dedicated Caregiver-SRD, and an improved roll-out of the COVID-SRD from 4.4 million beneficiaries in May to 5.1 million in June.
4.3. The role of the COVID-19 policies in preventing income poverty and inequality from rising to much higher levels
In Table 2, for each of the poverty lines the poverty headcount ratio is shown for a hypothetical scenario in which the COVID-19 policies are switched off (the row ‘All policies apart from COVID-19 policies’). These results are the same for April, May, and June as the input dataset and non-COVID-19 policies remain constant, but are shown for each month for completeness. In a hypothetical situation with no COVID-19 policies, it can be seen that poverty would have risen to 0.321 each month using the food poverty line (a 56 per cent increase from the baseline in March), and to 0.452 using the lower-bound poverty line (a 37 per cent increase from the baseline in March), and to 0.593 using the upper-bound poverty line (a 23 per cent increase from the baseline in March).
The COVID-19 policies played a particularly vital role for female-headed households, and households containing children or older people. Table 3 shows the poverty headcounts for three particularly vulnerable subgroups. The same overall pattern is observed as for the population as a whole: that is, poverty increases between March and April and then falls to levels lower than in March, though for these subgroups the fall to a level lower than in March occurs sooner (May) than for the population as a whole (June). For households containing one or more older people, poverty (as measured using the food poverty line) is almost obliterated. This will be driven by the R250 increase to the Old Age Grant from May onwards. The fall in poverty between the months of May and June will be due to the combined impact of the transition from an increase to the Child Support Grant payment (which occurred only in May) to a Caregiver SRD benefit (which started in June), and an improved role-out of the COVID-SRD benefit, as the number of beneficiaries increased from 4.4 million in May to almost 5.1 million people in June.
| Household subgroup | Scenario | March | April | May | June |
|---|---|---|---|---|---|
| Female-headed households | Existing policies (COVID-SRD dampened) | 0.243 | 0.263 | 0.204 | 0.190 |
| All policies apart from COVID-19 policies | N/A | 0.351 | 0.351 | 0.351 | |
| Households with older people | Existing policies (COVID-SRD dampened) | 0.096 | 0.121 | 0.008 | 0.009 |
| All policies apart from COVID-19 policies | N/A | 0.156 | 0.156 | 0.156 | |
| Households with children | Existing policies (COVID-SRD dampened) | 0.225 | 0.279 | 0.193 | 0.179 |
| All policies apart from COVID-19 policies | N/A | 0.339 | 0.339 | 0.339 |
Source: Authors’ analysis of output datasets from SAMOD V7.3-COVID.
Note: Simulated receipt of the COVID-SRD benefit was dampened to match actual receipt (applicable to May and June only). The household subgroups are not mutually exclusive. The food poverty line (R561 in April 2019 rands) was inflated from April 2019 rands to March, April, May, and June 2020 rands using the consumer price index and then averaged.
The COVID-19 polices greatly reduce the extent of poverty that would otherwise have existed: without them, poverty in female-headed households would have risen to 0.351 (a 44 per cent increase from the baseline in March), and poverty in households containing one or more older people would have risen to 0.156 (a 62 per cent increase from the baseline in March), and poverty in households containing one or more children would have risen to 0.339 (a 51 per cent increase from the baseline in March).
Table 4 shows the Gini coefficient for each month. From the first row it can be seen that inequality increased very slightly in April compared to March, but in May and June it fell to levels lower than in March. This was due to the reduced earnings in the top deciles, and increased incomes (mostly from the COVID-SRD and Caregiver-SRD) in the bottom deciles (as reflected in Figures 1–3). In the absence of any COVID-19 policies, inequality would have increased to 0.676.
| Scenario | Gini coefficient | |||
|---|---|---|---|---|
| March | April | May | June | |
| Existing policies (COVID-SRD dampened) | 0.644 | 0.648 | 0.631 | 0.613 |
| Existing policies (COVID-SRD not dampened) | N/A | N/A | 0.600 | 0.603 |
| All policies apart from COVID-19 policies | N/A | 0.676 | 0.676 | 0.676 |
Source: Authors’ analysis of output datasets from SAMOD V7.3-COVID.
Note: Simulated receipt of COVID-SRD benefit was dampened to match actual receipt (applicable to May and June only). The first row shows results for all simulated tax and benefit policies including COVID-19 policies. The COVID-19 policies comprise TERS (applied in April, May, and June); benefit increases (in May and June with the exception of the CSG increase, which was only in May); and new benefits (COVID-SRD in May and June; Caregiver-SRD in June). No results are shown for March and April in the middle row as the COVID-SRD benefit was only introduced in May. No results are shown for March in the bottom row as there were no COVID-19 policies in place.
As the COVID-19 benefit changes only commenced in May, it is possible to attribute the reduction of inequality in April from 0.676 (in the hypothetical situation of no COVID-19 policies) to 0.648 wholly to the TERS income received by furloughed workers. Similarly, as TERS is applied in a constant way in April, May, and June, the further reductions in inequality in May and June can be attributed to the COVID-19 benefits.
4.4. Summary of the distributional impact of the pandemic and COVID-19 policies between March and June 2020
Figure 5 shows the overall change between March and June 2020 in mean monthly household disposable income, by decile and for South Africa as a whole. The figure decomposes the changes into three parts: changes due to loss of earnings caused by the pandemic (shown in dark grey); the cushioning effects of automatic stabilizers—that is, the tax–benefit system in place prior to the pandemic (shown in light blue); and the additional effects of the newly introduced COVID-19 policies (shown in dark blue). Overall (the final column), mean household disposable income fell between March and June by 11.0 per cent. If this change is decomposed, the change in earnings accounts for a 24.7 per cent drop in disposable income; the change in automatic stabilizers accounts for a 4.1 per cent rise in disposable income; and the introduction of new COVID-19 policies (including TERS) accounts for a 9.6 per cent rise in disposable income.
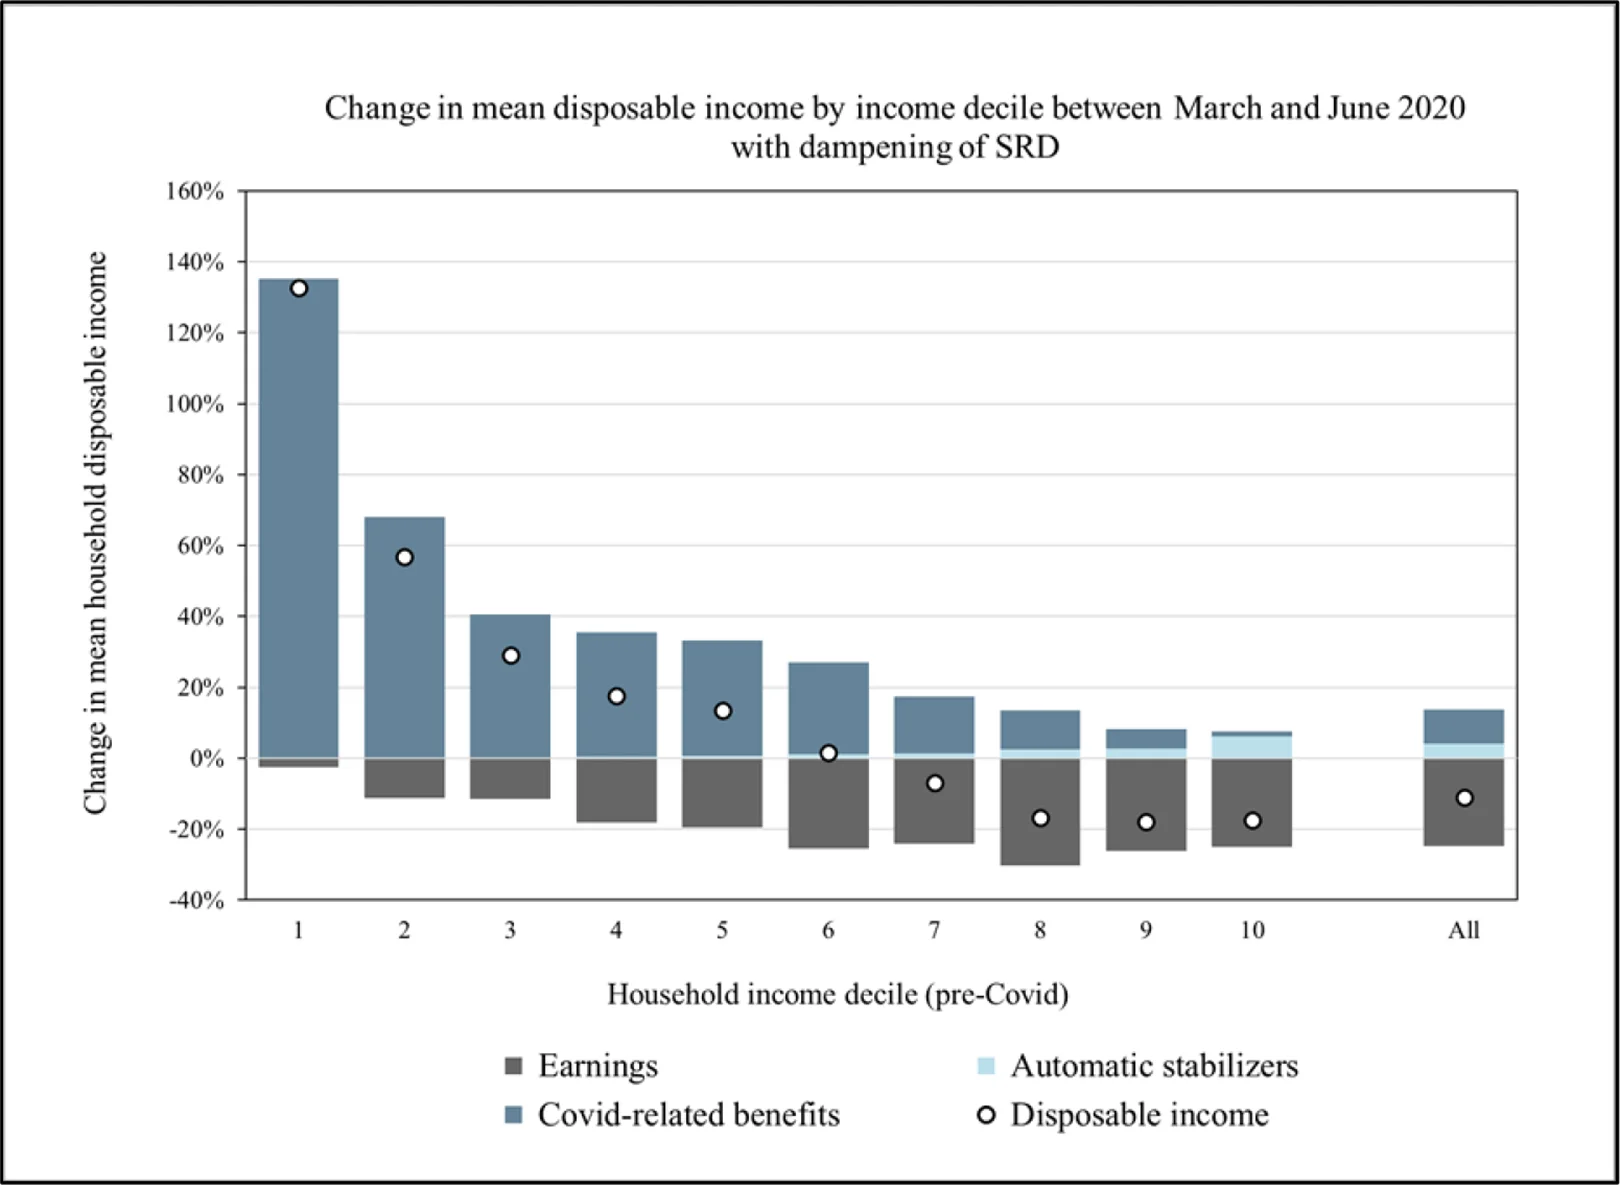
These numbers can be used to calculate the so-called income stabilization coefficient.10 When comparing March and April it amounts to 40 per cent;11 this measures the extent to which the automatic stabilizers and the TERS policy protected households from declines in market income. When comparing March and June, the income stabilization coefficient rises to 53 per cent, meaning that more than half of the drop in market income was avoided by the combined effects of automatic stabilization, TERS, and the COVID-19 benefit changes that were in place in June.
As can be seen, the mean disposable income increased in the lowest five deciles, remained largely unchanged for decile 6, and fell for deciles 7–10. The changes were driven by a combination of the introduction of the COVID-19 policies, a fall in earnings, and to a much lesser extent the role of the automatic stabilizers. Effects of the pre-COVID tax–benefit system (shown in light blue) at the top of the income distribution are mostly driven by the reduction in contributions to UIF and payments of personal income tax after earnings shocks.
The figure shows the important redistributional effect of the COVID-19 policies. However, although the percentage increases in mean disposable income are highest in the lowest deciles, the actual increases in rand amounts are very low (Figure 2).
Table 5 provides more detail about the profile of households in each of the deciles shown in Figure 5 in respect of earnings in March 2020 and April (and May and June) 2020. Only 13 per cent of households in the first (poorest) decile had earnings prior to the pandemic in March 2020, and this fell to under 9 per cent of households in April 2020. The mean earnings of those in the first decile are very low at both time points, which explains why the change in disposable income is so great in Figure 5 for the first decile between March and June: a COVID-SRD benefit of R350 per month is more or less equivalent to the mean monthly earnings of this decile.
| Decile | Percentage of households with earnings | Mean monthly earnings (rands) | ||
|---|---|---|---|---|
| March | April | March | April | |
| 1 (poorest) | 13.0 | 8.6 | 368 | 354 |
| 2 | 48.4 | 28.2 | 1,133 | 1,022 |
| 3 | 57.4 | 41.2 | 1,981 | 1,682 |
| 4 | 68.3 | 49.6 | 3,076 | 2,291 |
| 5 | 80.7 | 62.4 | 4,688 | 3,870 |
| 6 | 87.8 | 69.2 | 6,213 | 4,893 |
| 7 | 78.2 | 65.3 | 8,669 | 7,059 |
| 8 | 93.7 | 80.1 | 13,392 | 10,656 |
| 9 | 94.3 | 83.9 | 20,213 | 16,733 |
| 10 (richest) | 92.4 | 85.5 | 49,289 | 41,423 |
Source: Analysis of input datasets from SAMOD V7.3-COVID.
Note: Earnings are defined in this table as income from employment or self-employment. The April dataset includes the labour market shock induced by the pandemic and lockdown using predictions based on NIDS-CRAM Wave 1 (for more details, see Appendix C).
It should also be kept in mind that SAMOD simulated many fewer recipients of TERS than received the benefit in practice (Department of Employment and Labour, 2020); as explained above in more detail, it is assumed that a subset of those who reported earnings in NIDS-CRAM Wave 1 were actually reporting income derived from TERS. As a consequence, the findings about the impact of the pandemic on earnings (shown in dark grey) is likely to be understated (that is, there will have been greater drops in earnings), and the counterbalancing impact of TERS (shown in dark blue) is also likely to be understated for those working in the formal sector (that is, TERS will have played a larger role than shown in protecting people’s incomes). Nevertheless, this should not affect the combined impact of the shock and all policies on mean distributional incomes (the white dots in Figure 5) as the income sources are not differentiated.
In summary, the COVID-19 policies not only served to mitigate the impact of the pandemic and lockdown to a great extent, but also represent a long-overdue change in policy approach by providing social assistance to low-income adults of working age.
4.5. Comparison to some earlier analyses
This study has examined the impacts on poverty and inequality of a package of COVID emergency policies that were implemented by the South African government in late March 2020 in response to the arrival of the pandemic in South Africa. In the weeks preceding the announcement of this package, the government engaged intensively with South Africa’s research community over a range of possible interventions. Bassier et al. (2021) is one such study, originally written for the presidency in March 2020. It sought to use information from the NIDS Wave 5 survey of 2017 to investigate a set of emergency policies to support informal workers whose employment and earnings would be halted by a lockdown but who would not receive any relief through systems such as the UIF that rely on formal registration of employment. The evidence from NIDS Wave 5 was used to show that a very large proportion of such informal workers reside in households in the bottom deciles of the income distribution in which there are recipients of existing social grants, in particular the CSG. This made a case therefore that this grant could be re-purposed to provide substantial emergency relief to these workers and their households. They also showed that, if it were feasible to implement, a ‘Special COVID-19 Grant’ broadly targeting the unemployed and those in informal employment would be very effective in assisting these informal workers and mitigating COVID-19-associated poverty.
Quantitative work such as that of Bassier et al. (2021) used the 2017 situation to inform policy options by using ex-ante simulations of the impacts of various policy options. In this study, we have worked hard to ground our assessment on a base situation that prevailed in the country in 2020 on the eve of the pandemic and the lockdown. Then, we have incorporated reliable information on actual labour market outcomes between April 2020 and June 2020 in order to ensure that our simulations are assessing as closely as possible the impacts for incomes, poverty, and inequality of what actually happened in the labour market over this period.
Another useful point of comparison is a study by Zizzamia et al. (2020) based on NIDS-CRAM that matched job losers with observably similar job retainers in order to estimate poverty effects of COVID-induced job loss. Stressing that their results are highly approximate, they estimated that one million job losers (and three million people accounting for dependents) fell into poverty in April as a result of the COVID employment shock. This estimate incorporates grant receipt on the basis of survey responses and differs sharply to the poverty findings of this paper, but it must be borne in mind that the time point of April means SRD receipt would still have had a minimal effect on ameliorating poverty in their estimate.
5. Conclusions
This study examined the impacts of the coronavirus pandemic on household incomes, poverty, and inequality in South Africa during the first wave of infections in April–June 2020. We made use of information from the NIDS-CRAM survey to predict job and income losses for the representative sample of the general population that underpins the tax–benefit microsimulation model for South Africa, SAMOD. The changes made to existing social benefits and the new policies, introduced in 2020 to assist households to weather the pandemic, were included in the modelling. Households’ economic situations were then compared to the pre-crisis conditions in early March 2020.
The results indicate that while a decline in earnings would have caused a 25 per cent drop in disposable income on average, the overall drop in disposable income in June was much smaller at 11 per cent. Automatic stabilization played a role due to households losing income, paying less tax and becoming eligible for social grants. But the main contributor to the protection was the package of augmented and new benefits that was introduced, including the COVID-19-SRD, Caregiver-SRD, and TERS. Overall, the drop in disposable incomes was highest in absolute terms among higher-income households (Figure 3); conversely, mean disposable incomes increased for the poorest income deciles (Figures 3 and 4), although only by a small rand amount.
We estimate that poverty increased in May when compared to the pre-crisis levels: the poverty headcount went from 0.33 in March to 0.34 in May using Statistics South Africa’s lower poverty line. It dropped further in June to 0.31. This is because of the COVID-19 policies, which for the first time brought social benefits available to non-disabled adults not eligible for unemployment insurance. Of all the grants in the package, only the COVID-SRD required substantial new implementation systems to be put in place. Poverty reduction would have been greater if all those eligible for COVID-SRD had benefited from it; in other words, if its roll-out and take-up had been 100 per cent. Overall, the South African tax–benefit system provided considerable support for households during the first wave of the pandemic, even in an international comparison.12
We have not been able to address all facets of the pandemic or the policy response to it. We have concentrated on earnings and the role of direct taxes and transfers, whereas a full analysis would also need to take into account changes in capital income. Tax-paying firms also had the opportunity to defer tax payments, which has probably contributed in a significant way to their ability to survive and pay salaries during the crisis.13 We have not been able to capture the contribution of this policy in our analysis.
This study focussed on the time period of the first wave of the pandemic in South Africa, up to June 2020. Since then, the Caregiver-SRD grant and the increased monthly payments of the existing benefits by government ceased in October 2020. Furthermore the COVID-SRD benefit was terminated at the end of April 2021. Our work here suggests that the poverty situation therefore probably worsened in late 2020 compared to our study period. The country is now (in June 2021) embarking on a serious third wave during the winter season, and so the vital support that was provided during the first wave continues to be sorely missed.
One of the main takeaways of this analysis is the need to develop the South African social protection system further for the post-COVID world. The success of especially the COVID-19 benefit changes in poverty reduction underscores the need to have similar transfers in place in more normal times as well. That said, the present system was implemented as an emergency response and it should be further developed if it is to be made more permanent. For example, the COVID-SRD was put in place in great haste to fill a gap in emergency funding, and its application procedures are not easy to work with for potential beneficiaries. They could be simplified within a design framework that splices this grant into an integrated system of grants. Similarly, the means test for receiving SRD is exceptionally stringent (requiring applicants to have zero income) and it would need to be reconsidered and harmonized with those being applied to the other social grants. Introducing new benefits is costly, of course, but financing options exist. Also, in the spirit of this study, going forward there is so much to be learned for policy prioritization by careful evaluation of the effectiveness of policies in guiding the country through the COVID pandemic.
Footnotes
1.
2.
See Appendix A for a description of the model.
3.
See Appendix B for details of this part of the analysis.
4.
See Appendix C for details of this part of the analysis.
5.
See Table C5 for estimates of how employment transitions varied along the dimensions of race and education level based on NIDS-CRAM.
6.
Although people of working age (including caregivers) are not eligible for social assistance unless they are disabled, the social insurance scheme (Unemployment Insurance Fund) does exist, but this is time limited and depends on sufficient contributions having been made.
7.
The monthly R350 payment is USD 24.53, EUR 20.60, and GBP 17.66 (xe.com 28 June 2021), and is similar to the value of the mean monthly earnings of households in the poorest household income decile (see Table 5 below).
8.
Although most of the main tax and benefit policies that affect people’s incomes at the individual level are simulated in SAMOD V7.3-COVID, certain policies are not: value-added tax, grant in aid, the War Veterans Grant, and the usual UIF (i.e. non-TERS) payments. The only COVID-19 policy response that is not simulated is the introduction of tax payment deferrals.
9.
As mentioned earlier, TERS was generally distributed to workers through their employers, and so income derived from TERS would have been reported as earnings by many respondents. In addition, the NIDS-CRAM questionnaire makes no distinction between different sources of earnings and does not explicitly tell respondents to exclude TERS.
10.
See Dolls et al. (2012) for a description of the methodology.
11.
Calculated as one minus the change in disposable income divided by the change in market income.
12.
A similar analysis for Ecuador (another upper-middle-income country) shows, for example, a dramatic increase in poverty despite the introduction of a new social benefit (Jara et al., 2021). In the UK, while the income losses were smaller, the role of government protection is at roughly the same level as in South Africa (with a mean disposable income drop of 7 per cent against a corresponding reduction in earnings of 13 per cent in the UK) (Brewer and Tasseva, 2020).
13.
On the basis of the information in the 2021 budget review, taxpayers had used tax deferrals with a total value of R40 billion until mid-February 2021.
14.
See www.nids.uct.ac.za/nids-data/documentation/overview-documentation/wave-5.
15.
The pandemic was declared a national disaster on 15 March 2020 and a national lockdown was announced on 23 March 2020.
16.
In practice, it was not possible to ascertain which respondents from NIDS Wave 5 were ‘farmers’ and so this category was not coded in either the SAMOD input dataset or the QLFS external controls.
17.
All children aged 0–14 were assigned code 99 on the ‘les’ classification, irrespective of whether they had been assigned a different economic status in the raw NIDS data or raw QLFS data.
18.
In practice, it was not possible to identify armed forces personnel in the QLFS data, so this category was excluded. There were 15 respondents coded as ‘armed forces’ occupation in the NIDS data and these were recoded to ‘elementary occupation’.
19.
All children aged 0–14 were assigned code 999 on the composite ‘les_loc’ variable, irrespective of whether they had been assigned a different economic status in the raw NIDS data or raw QLFS data.
20.
This restriction to positive earners follows the precedent of Brewer and Tasseva (2020).
21.
A more sophisticated model that does not rely on the assumption of the ‘independent of irrelevant alternatives’ (IIA) property could be used in future work.
22.
Due to small numbers in the Asian/Indian group, a three-category race variable was used for regressions that collapsed the Coloured and the Asian/Indian groups into one category.
23.
Due to a lack of available data, marriage status was not included as a regressor.
24.
Note that this classification means that a few individuals who reported zero earnings in April but still worked positive days will be placed in the reduced earnings group rather than the furloughed group.
25.
Note that the earnings variables in the input data have no missing values, which means there is no distinction between zero-earners and missing data (in contrast with NIDS-CRAM). The multinomial logit is restricted to February positive earners, which attenuates the effect this difference has, while the inability to distinguish between zero-earners and missing in April is largely consistent with the coding in NIDS-CRAM, which treated missing as sufficient to classify people as having zero earnings or earnings reductions.
26.
This is in line with the method of Brewer and Tasseva (2020). Once again, a 15 per cent threshold is used for what counts as an earnings reduction.
Appendix A
SAMOD microsimulation model description
SAMOD is a static tax–benefit microsimulation model for South Africa (Wright et al., 2016). It was developed and is maintained by members of Southern African Social Policy Research Insights. The model uses the EUROMOD software developed by Professor Holly Sutherland and colleagues at the University of Essex to simulate policies for the countries in the EU (Sutherland and Figari, 2013; University of Essex, 2019). The EUROMOD software was designed to enable analysis across countries using harmonized concepts and methodology, and is sufficiently flexible to be applicable to countries outside the EU, with South Africa being the first developing country to use the software (Wilkinson, 2009).
The analysis presented in this paper is based on SAMOD Version 7.3-COVID, which uses Version 3.1.8 of the EUROMOD software. SAMOD draws on underpinning input micro-datasets which are stored within the model as text files. The two underpinning datasets that are used in the analysis in this note are modified versions of the 2017 National Income Dynamics Study Wave 5 (SALDRU (Southern Africa Labour and Development Research Unit), 2017).14
South Africa’s tax and benefit rules for each of March, April, May, and June 2020 were added into SAMOD using harmonized EUROMOD commands. These rules are applied by the model to all individuals in the relevant underpinning dataset, taking into account characteristics such as age, gender, marital status, and detailed information on income sources. The taxes paid and benefits received by each individual are calculated on-model (simulated), so there is no need to rely on reported receipt. This enables the ‘next-day’ financial impact of the simulated policies on individuals to be calculated.
The model output comprises an individual-level text file for each run of the model, which can then be analysed in STATA. The datasets and tax–benefit systems used in the analysis for this background note are summarized in Table A1.
| Era and dataset name | Month in 2020 | System name | System summary(tax and benefit policies) |
|---|---|---|---|
| Pre-crisis SA_2017_b3_pre_2 |
March | sa_2020_march | Actual policies in March |
| Crisis SA_2017_b3_April |
April | sa_2020_april | Actual policies in April |
| sa_2020_april_noters | Existing policies excluding those introduced because of COVID | ||
| May | sa_2020_may | Actual policies in May | |
| sa_2020_may_damp_bsaon | Existing policies but COVID-SRD dampened to actual figures | ||
| sa_2020_may_nocovidpols | Existing policies excluding those introduced because of COVID | ||
| June | sa_2020_june | Actual policies in June | |
| sa_2020_june_damp_bsaon | Existing policies but COVID-SRD dampened to actual figures | ||
| sa_2020_june_nocovidpols | Existing policies excluding those introduced because of COVID |
Appendix B
Reweighting the SAMOD input dataset to a pre-COVID timepoint
This appendix summarizes the steps taken to prepare a baseline dataset for SAMOD for this study. The objective was to generate an input dataset that would reflect the situation in South Africa immediately prior to the pandemic. This was achieved by reweighting the SAMOD dataset to a ‘pre-COVD’ timepoint of March 2020.15 Selected diagnostic outputs are also included in this appendix to illustrate the impact of the reweighting exercise on the distribution of survey weights.
The objective of the reweighting procedure was to recalibrate the survey weights in the SAMOD input dataset so that the weighted population totals corresponded to estimated demographic profiles and labour market profiles for March 2020. This was achieved through a two-stage process. First, the SAMOD input dataset was reweighted to match external demographic and labour market profiles for the timepoint at which NIDS Wave 5 was enumerated (mid-2017). Second, the reweighting was performed again, this time controlling to demographic and labour market profiles for March 2020. The advantage of adopting this two-stage approach is that it enables an assessment of the magnitude of weight changes at each stage. The demographic profiles were derived from Statistics South Africa’s population estimates by population group, age, and sex. The labour market profiles were derived from Statistics South Africa’s QLFS.
The reweighting process was undertaken using the technique of iterative proportional fitting (IPF; also referred to as ‘raking’). The Stata .ado file ‘ipfraking’ was utilized for this purpose.
The reweighting procedure consisted of five main stages:
Stage 1: preparing the external population control totals relating to demographic profile.
Stage 2: preparing the external population control totals relating to labour market profile.
Stage 3: preparing the SAMOD input dataset prior to running IPF.
Stage 4: running the IPF procedure, first for mid-2017 then for March 2020.
Stage 5: performing quality assurance tests on the reweighted input datasets.
Stage 1: preparing the external population control totals relating to demographic profile
This step consisted of extracting the relevant population estimates from the file produced by Statistics South Africa and structuring the data into separate Excel worksheets for the relevant years. The population estimates produced by Statistics South Africa consist of estimated counts by age, sex, and population group. There are 34 separate quinary age/sex groups for each of the four population groups, resulting in 136 discrete demographic categories (i.e. 34 × 4 = 136). Population estimates are available for all 136 demographic categories at the mid-point of each year.
Following the NIDS weight calibration approach adopted by Branson and Wittenberg (2019), prior to implementing the IPF procedure the three most elderly Indian/Asian age groups (70–74, 75–79, and 80+) were collapsed into a combined ‘aged 70+’ category for males of the Indian/Asian population group and also separately for females ‘aged 70+’ of the Indian/Asian population group. This resulted in a final age/sex/population group classification consisting of 132 discrete categories derived from the Statistics South Africa population estimates.
To derive population estimates for the March 2020 timepoint, it was necessary to interpolate between the population estimates for mid-2019 and mid-2020. A simple linear interpolation approach was used to derive the estimates for March 2020.
Stage 2: preparing the external population control totals relating to labour market profile
This step entailed the derivation of labour market profiles from specific waves of the QLFS. Weighted population shares by labour market category were calculated for two separate classifications: (1) ‘current economic status’ (relating to the ‘les’ variable in the SAMOD input dataset); and (2) ‘occupation type’ (relating to the ‘loc’ variable in the SAMOD input dataset). A composite classification, named ‘les_loc’, was then derived by disaggregating the ‘self-employed’ and ‘employees’ according to their occupation type. These external statistics were calculated using QLFS waves 2017 Q2 and 2020 Q1.
The ‘les’ classification adhered to the following coding scheme:
1 = Farmer16
2 = Employer or self-employed
3 = Employee
4 = Pensioner
5 = Unemployed
6 = Student
7 = Inactive
8 = Sick or disabled
9 = Other
99 = Aged 0–1417
The ‘loc’ classification adhered to the following coding scheme:
0 = Armed forces occupations18
1 = Managers
2 = Professionals
3 = Technicians and associate professions
4 = Clerical support workers
5 = Service and sales workers
6 = Skilled agricultural, forestry, and fisheries
7 = Craft and related trades workers
8 = Plant and machine operators
9 = Elementary occupations
The ‘les_loc’ classification adhered to the following coding scheme:
201 = Employer or self-employed: Managers
202 = Employer or self-employed: Professionals
203 = Employer or self-employed: Technicians and associate professions
204 = Employer or self-employed: Clerical support workers
205 = Employer or self-employed: Service and sales workers
206 = Employer or self-employed: Skilled agricultural, forestry and fisheries
207 = Employer or self-employed: Craft and related trades workers
208 = Employer or self-employed: Plant and machine operators
209 = Employer or self-employed: Elementary occupations
301 = Employee: Managers
302 = Employee: Professionals
303 = Employee: Technicians and associate professions
304 = Employee: Clerical support workers
305 = Employee: Service and sales workers
306 = Employee: Skilled agricultural, forestry, and fisheries
307 = Employee: Craft and related trades workers
308 = Employee: Plant and machine operators
309 = Employee: Elementary occupations
400 = Pensioner
500 = Unemployed
600 = Student
700 = Inactive
800 = Sick or disabled
900 = Other
999 = Aged 0–1419
The QLFS labour market shares were then adjusted to take account of the appropriate population totals derived from the Statistics South Africa population estimate external control totals produced in Stage 1 of the reweighting procedure. The total population across the ‘les_loc’ classification derived from the QLFS was scaled to match the total population from the Statistics South Africa population estimates. Furthermore, the ‘les_loc’ category ‘999’ derived from the QLFS was fixed at the value of the population estimate for children aged 0–14 from Statistics South Africa. The QLFS labour market shares by ‘les_loc’ for people aged 15+ were then applied to the population estimate for people aged 15+ according to the Statistics South Africa estimates. Scaling the QLFS labour market profile to the respective population totals ensured that the sum of the labour market categories matched the sum of the age/sex/population group categories, thereby maintaining internal consistency between the two sets of external controls. Although this was not strictly necessary for the reweighting process, it provided methodological clarity as the adjustments to the control totals were explicitly defined rather than being implicitly generated during the reweighting procedure.
Stage 3: preparing the input datasets
This step consisted of producing derived variables in the SAMOD input dataset to match the categories of the external control totals. A new variable, ‘pgagesex’, was derived in the SAMOD input dataset to categorize the survey respondents according to their population group, quinary age group, and sex.
As noted in the step above, in order to enable the labour market profile to be explicitly controlled during the reweighting process, the variables ‘les’ and ‘loc’ from the SAMOD input dataset (i.e. ‘current economic status’ and ‘occupation type’) were combined to form a composite variable called ‘les_loc’.
Stage 4: running the iterative proportional fitting procedure
The ‘ipfraking’ Stata .ado file was used to operationalize the iterative proportional fitting procedure. The first round of iterative proportional fitting was configured to reweight the SAMOD input dataset so that the demographic and labour market profiles of the reweighted survey counts matched the demographic and labour market profiles in the external control totals for the 2017 year of survey enumeration.
The process commenced with the importation of the external control totals (both demographic profile and labour market profile) from the specified Excel files into Stata matrices. The ‘ipfraking’ command was then configured according to the specification of the SAMOD input dataset. Running a ‘summarize’ command on the original survey weight variable (dwt) in the input dataset revealed the range and distribution of the original survey weights. This information was then used to inform the setting of the trimming parameters in the ‘ipfraking’ command, which allowed the configuration of both absolute and relative trim limits within which the ‘ipfraking’ procedure was forced to operate. There is no hard rule in terms of how the trimming parameters should be configured, so these parameter values were specified according to the distribution of original survey weights and to ensure convergence of the ‘ipfraking’ procedure. The setting of trimming parameters inevitably involved an element of trial and error, with the parameter values gradually relaxed or tightened and the results from the ‘ipfraking’ procedure reviewed. The objective was to achieve convergence of the procedure to within the specified tolerances, while minimizing the magnitude of changes to individual weights and minimizing changes to the overall range and distribution of the weights.
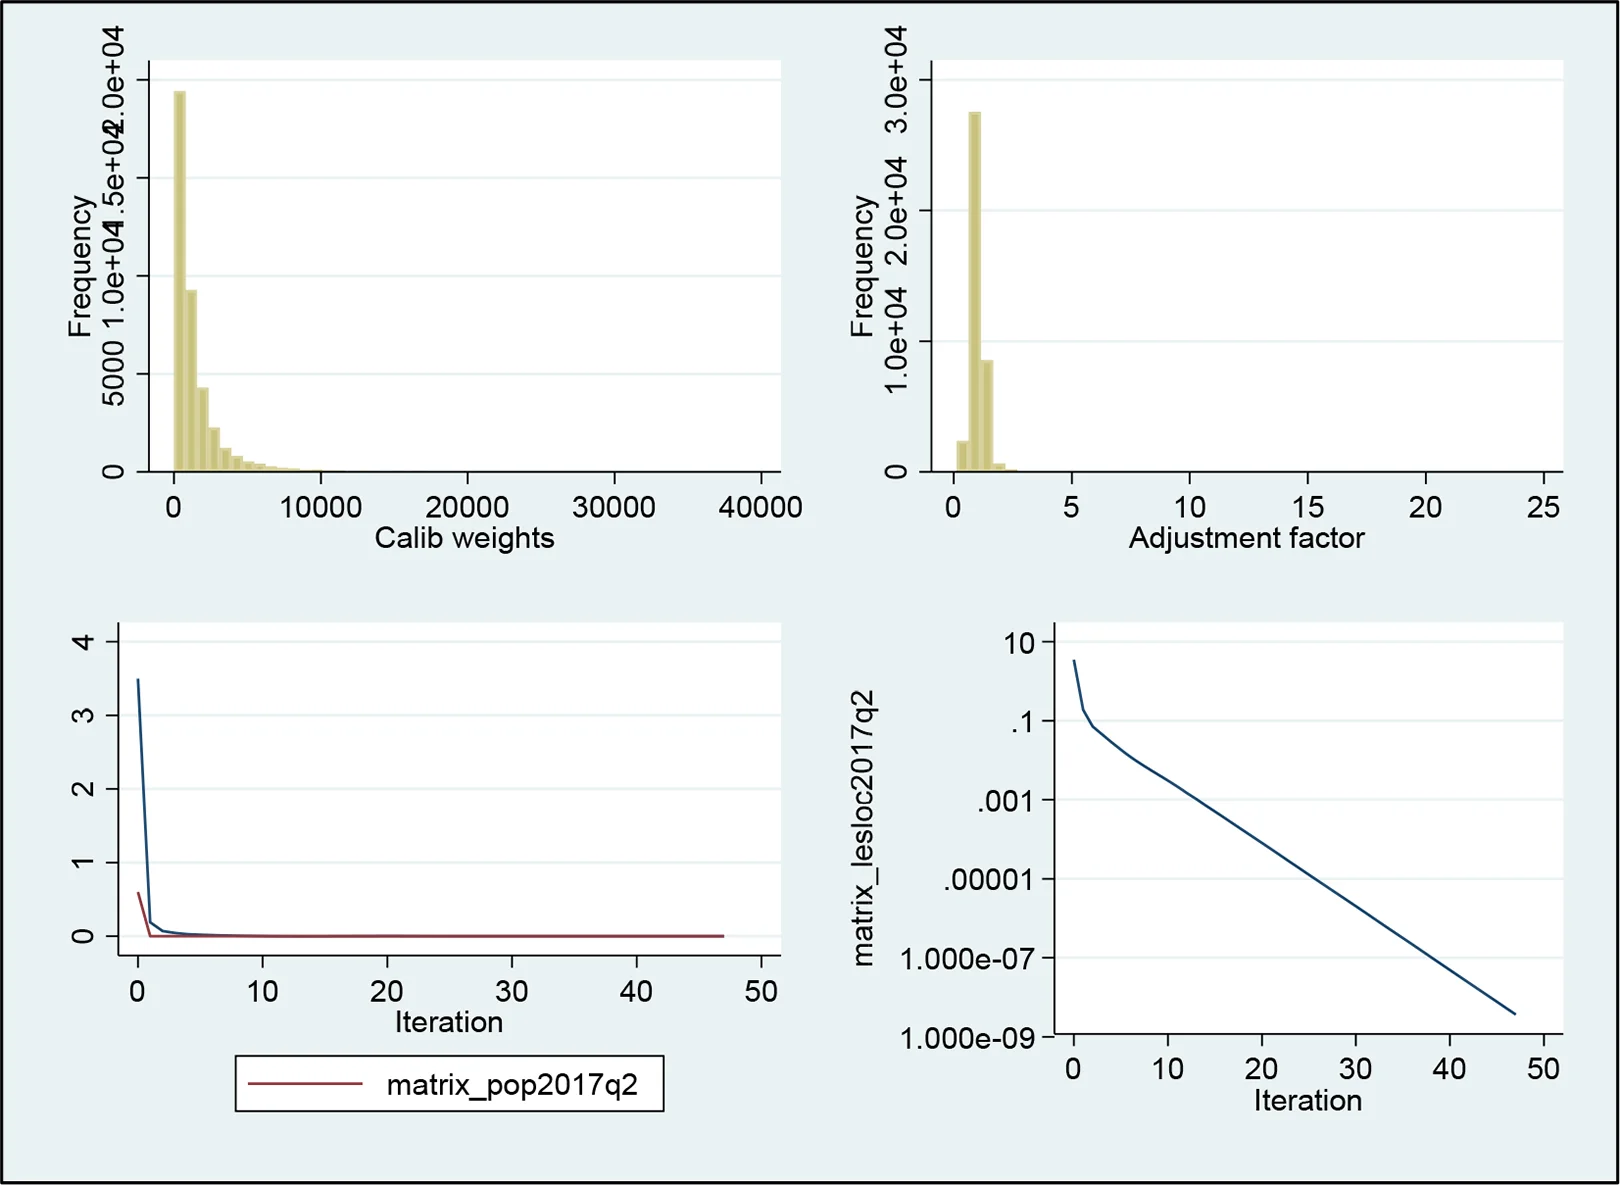
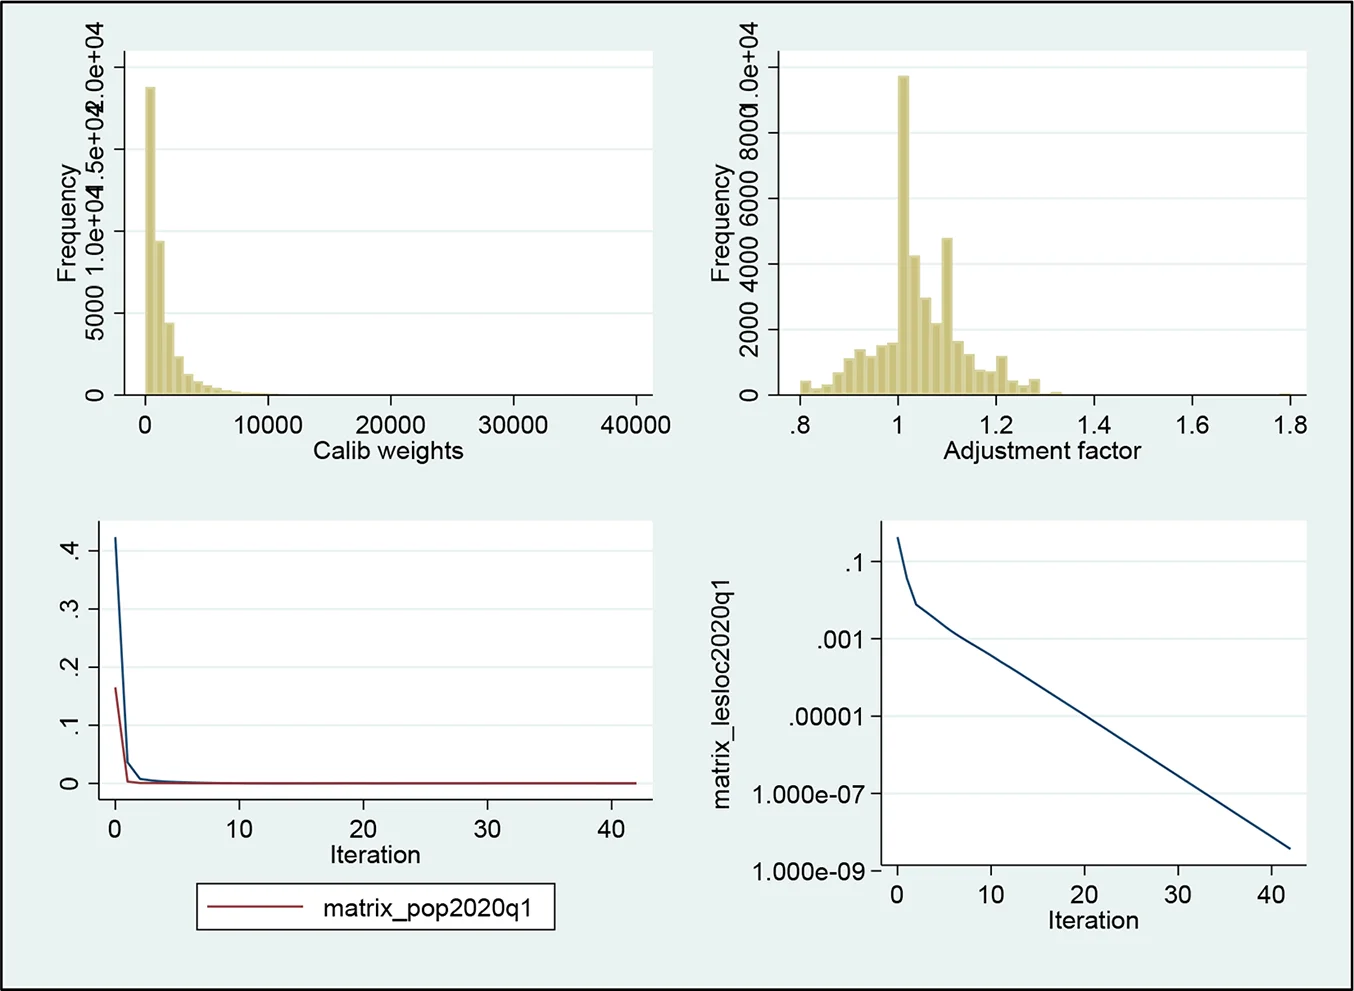
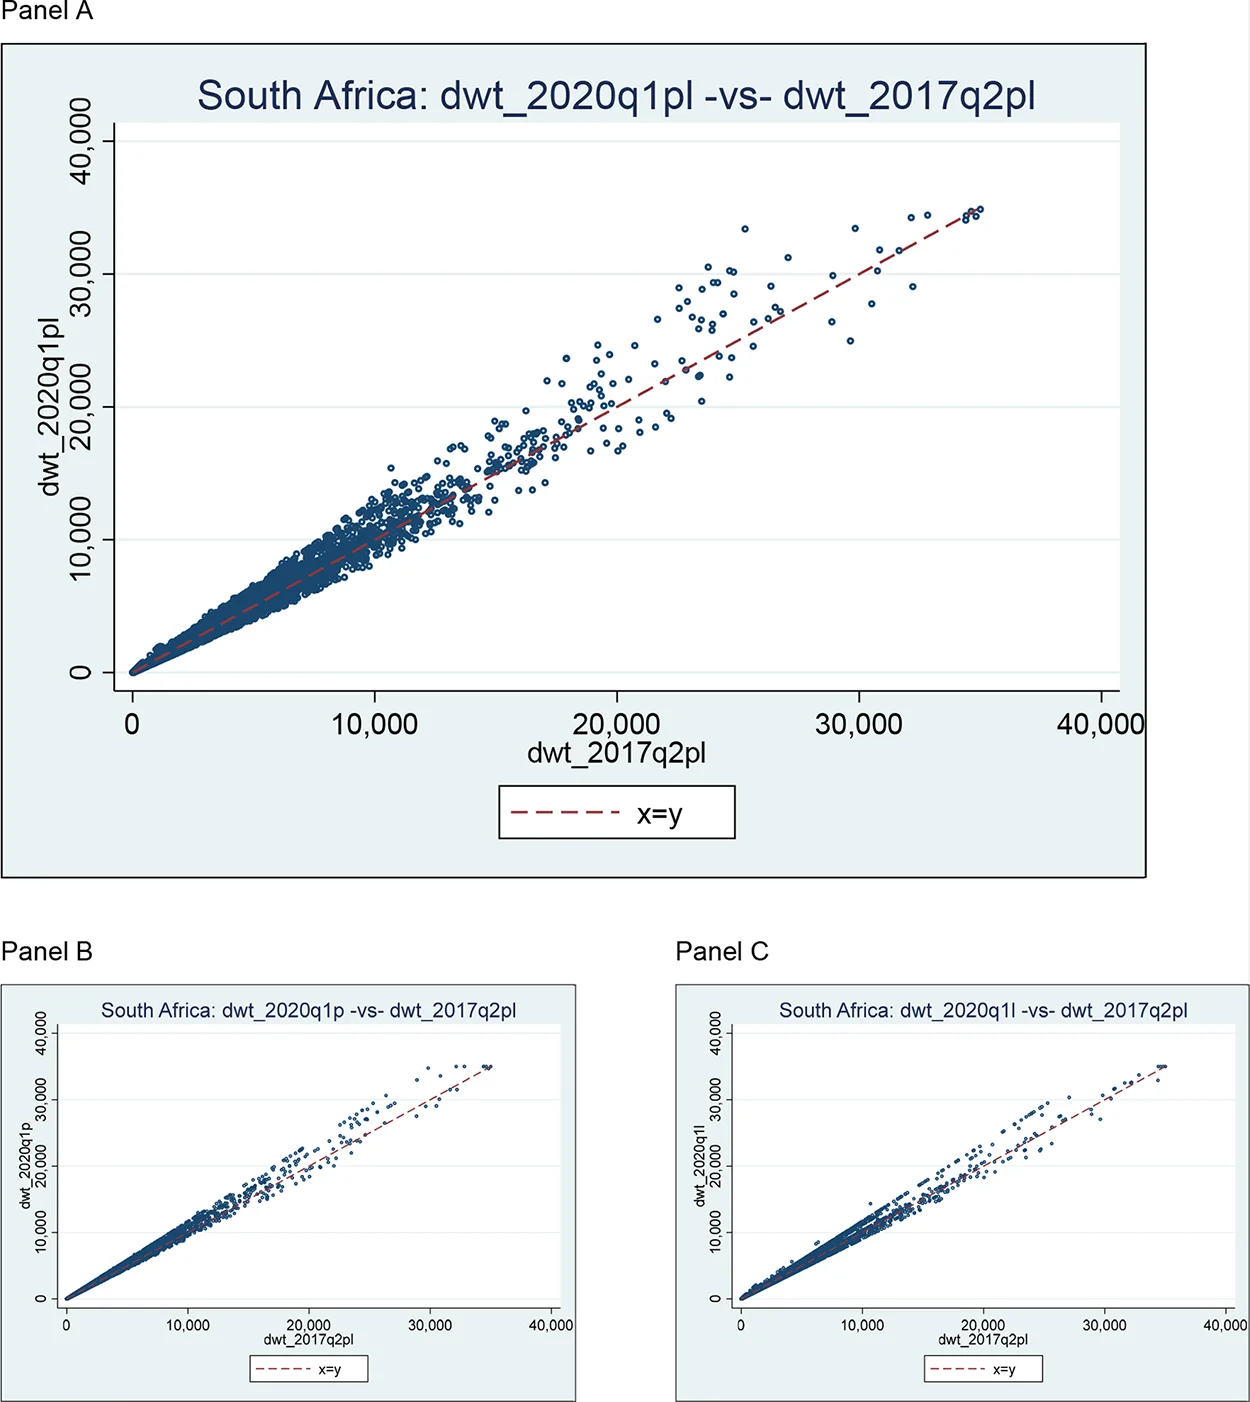
The second part of the ‘ipfraking’ procedure entailed reweighting the survey to the demographic and labour market profiles for the March 2020 timepoint. This time, a ‘summarize’ command was run on the rebased 2017 survey weights, calculated as described above, and this weight distribution informed the configuration of the trimming parameters in the rebasing to March 2020. Again, having specified the initial trimming parameters based upon the results of the ‘summarize’ commands, a process of ‘trial and error’ was undertaken to refine the reweighting procedure in order to achieve convergence while minimizing distributional change to the weights. Figures B1 and B2 show distributional plots and trace plots illustrating the results of the ‘ipfraking’ procedure for SAMOD.
Stage 5: performing quality assurance tests on the reweighted input datasets
The final part of the ‘ipfraking’ procedure entailed the following: first, reviewing the outputs from the reweighting exercise to ensure that the weighted counts by demographic profile and labour market profile corresponded to the external control totals; and second, assessing the magnitude of change in the weights generated through the reweighting process.
Figures B1–B4 show key results from the quality assurance exercise. The validation work indicated that the rebased survey weights for the baseline were in line with each of the external control totals and the distributions were plausible when considered in the context of the distributions of the original survey weights in the input datasets.
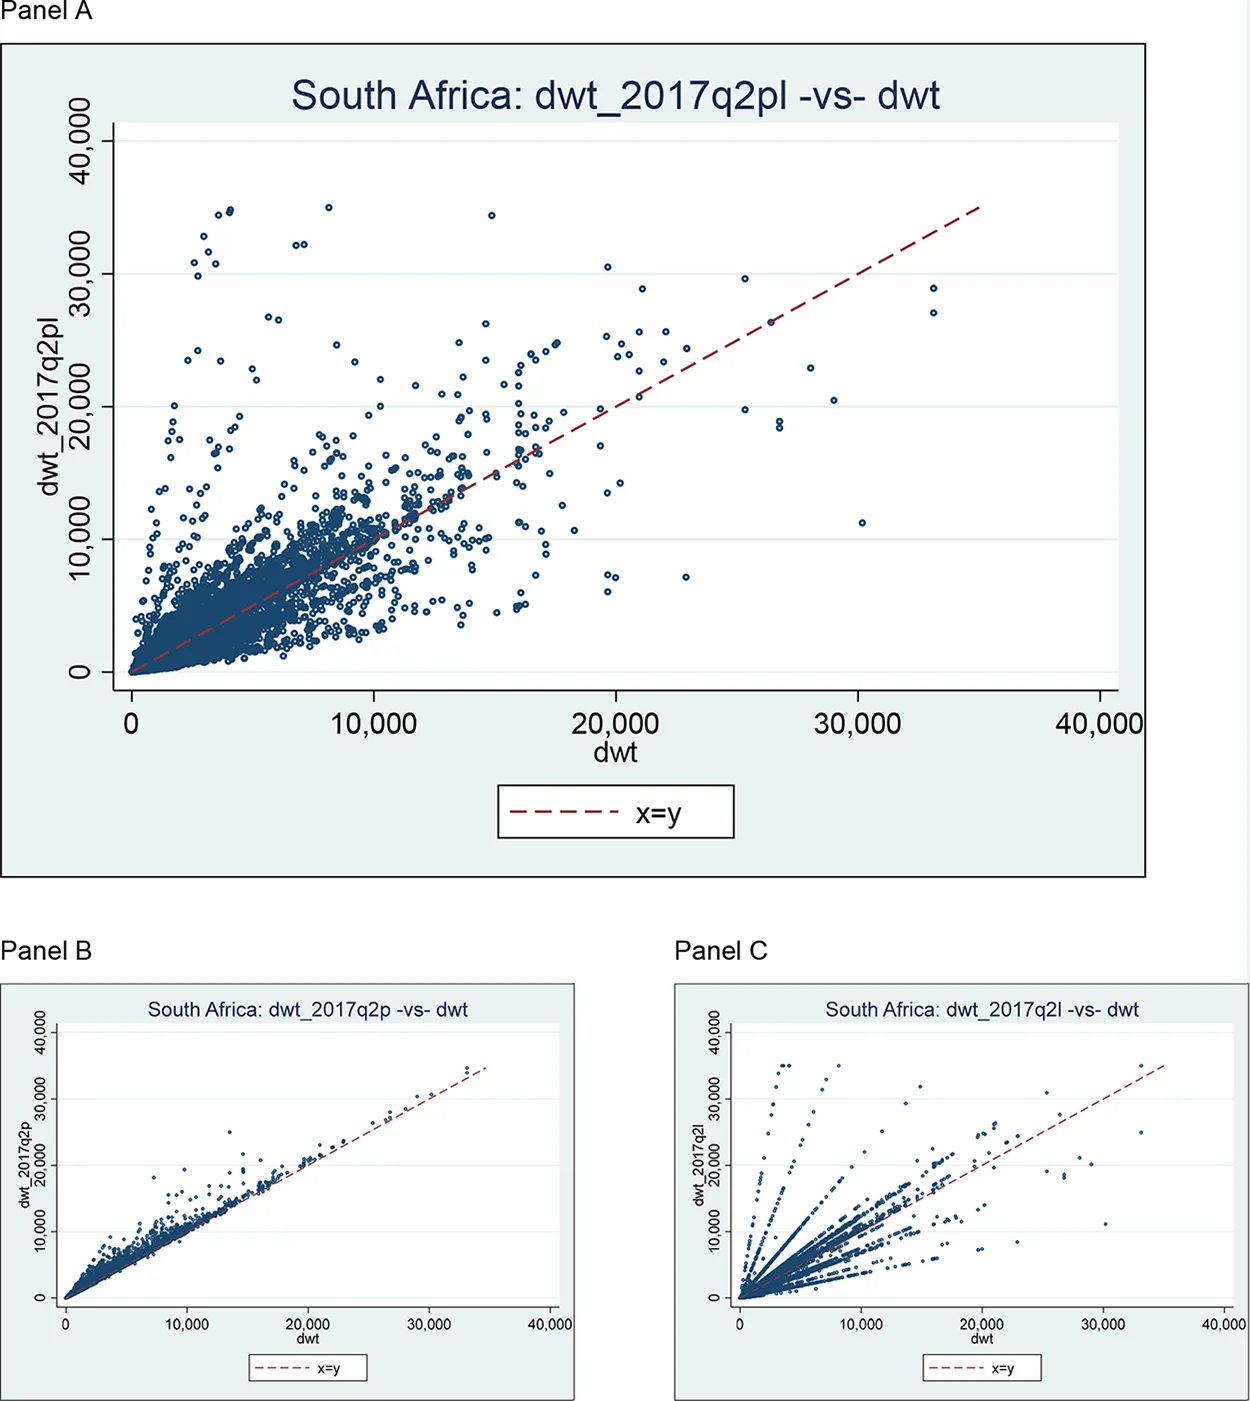
It can be seen from figures B3 and B4 that the most substantive adjustments to the survey weights occurred in the rebasing of the original weights to the mid-2017 timepoint, controlling to the external demographic and labour market control totals. Panel A of Figure B3 shows the overall composite effect of rebasing from the original survey weight to the rebased mid-2017 weight, controlling to demographic and labour market totals. The overall effect can be disaggregated to assess the relative contributions of the demographic and labour market controls separately, and these are shown in Panels B and C of Figure B3, respectively. These panels show that both the demographic and labour market elements of the rebasing had notable effects.
With regards to the demographic controls for mid-2017, it is evident from Panel B of Figure B3 that the original survey weights were typically increased through the rebasing procedure. This was a necessary step to account for the calibration approach adopted in the original NIDS data, whereby individual-level non-response cases (within enumerated households) were allocated a survey weight, despite no information being captured in the survey concerning these ‘non-response’ individuals’ incomes or labour market status. As SAMOD must be based on an underpinning dataset with no missing values, any ‘non-response’ individuals had to be excluded from the dataset. The weight rebasing procedure therefore adjusted the weights to ensure that the weighted total of enumerated cases in the NIDS survey equated to the total population estimate from Statistics South Africa.
With regards to the labour market controls for mid-2017, there were differences in the labour market profiles enumerated by the QLFS compared to NIDS. As one of the purposes of this reweighting procedure was to use the QLFS to account for labour market change between mid-2017 and March 2020, it was first necessary to reweight the NIDS data to reflect the QLFS labour market profile in mid-2017. Panel C of Figure B3 shows the effects of reweighting the NIDS data so that the weighted labour market totals equated to the QLFS external statistics.
Figure B4 shows the effects of moving from the rebased mid-2017 timepoint to the ‘pre-crisis’ timepoint of March 2020. It is evident that the magnitude of difference between the rebased mid-2017 weights and the ‘pre-crisis’ March 2020 weights is much less than the magnitude of difference between the original survey weights and the rebased mid-2017 weights.
Appendix C
Modelling labour market transitions on the basis of NIDS-CRAM
This appendix describes the simulation of the COVID-19 employment shock and the accompanying lockdowns in the input data (after updating to March 2020 pre-lockdown levels). The employment shock is estimated using NIDS-CRAM Wave 1 (referred to as the ‘shock data’).
NIDS-CRAM is a broadly representative individual-level survey implemented using CATI and focusing on adult individuals’ responses to the COVID-19 pandemic and national lockdown (Ingle et al., 2020). Conducted in May, respondents were asked retrospectively about their employment in April (after the imposition of the level 5 lockdown) and in February (pre-lockdown).
Given the structure of this data and its similarity to that used in the UK, this methodology draws principally from that of Brewer and Tasseva (2020) in terms of regression design and dependent variables. Principally, this means that we model probabilities of the employed transitioning into different states, rather than probabilities of being employed or not in the COVID era.
In line with the UKMOD (Brewer and Tasseva, 2020) and ECUAMOD (Jara et al., 2021) studies, this methodology focuses on estimating employment shocks (and enabling poverty and inequality estimates) at the peak of the crisis (i.e. in April when the level 5 lockdown was in place), leaving estimates of further developments in June and beyond to future work.
C.1. Modelling the employment shock using NIDS-CRAM
For February employed with positive earnings,20 a multinomial logit model was run,21 with the dependent variable being April employment outcome with four possible values: (1) employed with no drop in earnings; (2) employed with decreased earnings; (3) furloughed; and (4) not employed.
Because of a lack of information with which to characterize the kind of work people were doing in the pre-COVID scenario, a single model was run for all employed rather than separate models for different kinds of workers (e.g. for the employed and the self-employed).
The regressors for the multinomial logit were age (in ten-year brackets), a female dummy, race,22 education dummies, an urban dummy, occupation, baseline earnings quintile, and interactions between the female dummy and the race, education, and income quintile variables. These particular interactions are included because of exploratory findings for an interaction between gender and these factors in the early part of the lockdown (as found in NIDS-CRAM; Casale and Posel, 2020).
These regressors largely match those used by Jara et al. (2021) with the addition of race, occupation, and baseline earnings quintile.23 Occupation was not asked for February employment in NIDS-CRAM, so April occupation is used for those who remained employed in April while last/usual occupation is used for those who were no longer employed in April.
In NIDS-CRAM, respondents could respond to earnings questions using bracket responses. Bracket midpoints were imputed for these respondents in all earnings calculations. Note that no detection or omission of outliers was performed, and that earnings remain in April 2020 rands (ZAR).
In dealing with earnings we had to make value judgements about thresholds (i.e. what counts as an earnings reduction) and how to deal with missing responses. An earnings reduction of 15 per cent or more was set as the threshold for what counted as an earnings reduction. Further, anyone who had positive February earnings and remained employed in April but with missing earnings data was also classified as having decreased earnings. This means that anyone who remained employed between February and April and had an earnings reduction of 15 per cent or less was classified as employed with no drop in earnings.
Anyone who still reported an employment relationship, or employment to return to, but had both zero (or missing) earnings and zero (or missing) days worked (or reported being on leave) was considered to be furloughed (Table C1).24
| April employment outcome | ||||||
|---|---|---|---|---|---|---|
| Employed with a reduction in earnings | Furloughed | No longer employed | ||||
| 15–24 years | 0 | (.) | 0 | (.) | 0 | (.) |
| 25–34 years | 0.289 | (0.66) | 0.0120 | (0.03) | 0.120 | (0.43) |
| 35–44 years | 0.492 | (1.07) | −0.0866 | (−0.22) | −0.0969 | (−0.32) |
| 45–54 years | 0.179 | (0.38) | 0.106 | (0.28) | 0.0263 | (0.08) |
| 55+ years | 0.403 | (0.84) | 0.563 | (1.27) | −0.0676 | (−0.17) |
| Urban | −0.0868 | (−0.37) | −0.189 | (−0.71) | 0.0450 | (0.24) |
| 1.Managers | 0 | (.) | 0 | (.) | 0 | (.) |
| 2.Professionals | −0.199 | (−0.48) | −0.688 | (−1.11) | −0.327 | (−0.57) |
| 3.Technicians and associate professionals | −0.0749 | (−0.16) | −0.355 | (−0.51) | −0.0279 | (−0.05) |
| 4.Clerical support workers | 0.355 | (0.71) | −0.115 | (−0.18) | 0.254 | (0.47) |
| 5.Service and sales workers | 0.0806 | (0.18) | 0.270 | (0.45) | 0.0418 | (0.08) |
| 6.Skilled agricultural, forestry, and fishery workers | 0.416 | (0.60) | −0.555 | (−0.59) | −0.226 | (−0.35) |
| 7.Craft and related trades workers | 0.330 | (0.72) | 0.670 | (1.01) | 0.0275 | (0.05) |
| 8.Plant and machine operators, and assemblers | 0.0751 | (0.14) | −0.0198 | (−0.03) | 0.774 | (1.48) |
| 9.Elementary occupations | 0.00397 | (0.01) | 0.123 | (0.19) | 0.294 | (0.60) |
| Female | −0.131 | (−0.09) | 0.767 | (0.47) | −0.833 | (−0.61) |
| African | 0 | (.) | 0 | (.) | 0 | (.) |
| Coloured/Asian/Indian | 0.501 | (1.42) | −1.582* | (−2.54) | −0.546 | (−1.15) |
| White | 0.457 | (1.08) | −0.113 | (−0.19) | −0.00196 | (−0.00) |
| No education | 0 | (.) | 0 | (.) | 0 | (.) |
| Primary | 0.852 | (0.67) | 1.359 | (0.92) | 0.138 | (0.11) |
| Incomplete secondary | −0.270 | (−0.22) | 1.771 | (1.23) | 0.202 | (0.17) |
| Matric | −0.0546 | (−0.04) | 1.131 | (0.78) | 0.445 | (0.38) |
| Tertiary | −0.108 | (−0.09) | 2.010 | (1.37) | 0.0400 | (0.03) |
| Earning quintile 1 | 0 | (.) | 0 | (.) | 0 | (.) |
| Earning quintile 2 | −0.283 | (−0.45) | −0.904 | (−1.93) | −0.643 | (−1.85) |
| Earning quintile 3 | 0.511 | (1.01) | −1.099** | (−2.77) | −1.600*** | (−5.03) |
| Earning quintile 4 | 0.543 | (1.10) | −1.737*** | (−3.97) | −1.137*** | (−3.43) |
| Earning quintile 5 | 0.847 | (1.67) | −1.579** | (−2.79) | −2.550*** | (−5.45) |
| 2.Female # African/Black | 0 | (.) | 0 | (.) | 0 | (.) |
| 2.Female # Coloured/Asian/Indian | −1.158 | (−1.87) | 1.793 | (1.95) | 0.451 | (0.68) |
| 2.Female # White | 0.712 | (1.10) | 0.599 | (0.78) | 0.488 | (0.63) |
| 2.Female # None | 0 | (.) | 0 | (.) | 0 | (.) |
| 2.Female # Primary | −0.988 | (−0.63) | −0.684 | (−0.40) | 0.990 | (0.66) |
| 2.Female # Incomplete Secondary | 0.739 | (0.48) | −1.668 | (−1.00) | 1.002 | (0.72) |
| 2.Female # Matric | 1.076 | (0.70) | −0.493 | (−0.29) | 1.428 | (1.03) |
| 2.Female # Tertiary | 1.282 | (0.84) | −0.827 | (−0.49) | 1.432 | (1.02) |
| Female # Earning quintile 1 | 0 | (.) | 0 | (.) | 0 | (.) |
| Female # Earning quintile 2 | 0.722 | (1.04) | 0.219 | (0.35) | −0.183 | (−0.44) |
| Female # Earning quintile 3 | −0.900 | (−1.49) | 0.200 | (0.38) | 0.374 | (0.88) |
| Female # Earning quintile 4 | −1.016 | (−1.48) | 0.505 | (0.63) | −0.396 | (−0.91) |
| Female # Earning quintile 5 | −2.229** | (−2.95) | −1.237 | (−1.37) | 0.0898 | (0.13) |
| Constant | −2.289 | (−1.59) | −2.406 | (−1.53) | −0.646 | (−0.50) |
Source: Authors’ calculations based on NIDS-CRAM and SAMOD data.
Note: t statistics in parentheses. All equations are relative to the baseline outcome of ‘employed with no drop in earnings’. * p < 0.05, ** p < 0.01, *** p < 0.001.
From the full sample of February employed with positive earnings (N = 3,232), 46 had missing April employment data. A further 12 had missing educational data, 2 had missing urban/rural data, 394 had missing imputed February occupation, and 191 had missing baseline earnings quintile data. When all regressors were included the final sample size for the estimation was 2,716. There was a reduction of 516 due to missing data.
The predictive power of the model was low in general, with very few significant coefficients. The one exception was baseline (February) earnings quintiles, with higher quintiles predictive of a lower chance of losing employment and a lower chance of becoming furloughed. For the employed with the decreased earnings outcome, a significant interaction between gender and earnings quintile 5 meant that wealthy women were less likely to face reduced earnings, while men were more likely to do so.
C.2. Application of the employment shock to the SAMOD input data
The coefficients from the logit above were then used to predict the probabilities of transitioning into different states for employed individuals in the input data. Respecting these probabilities, individuals were randomly assigned to employed with no drop in earnings, employed with a drop in earnings, furloughed, and no longer employed categories. In essence, the probability space between 0 and 1 is divided in accordance with each individual’s probabilities of entering different states. Then, a random draw between 0 and 1 determines their assigned outcome. For example, someone who had a predicted probability of becoming furloughed of 0.1 would have only a 10 per cent chance of being assigned furloughed, but could still get this outcome should their random draw align with this outcome. However, the overall distribution of predicted outcomes will broadly follow the mean probabilities of entering each state because of the weighting of the probability space. Further, if the model is capturing the characteristics that determined employment changes, then the simulation should also capture the distribution of employment effects across different kinds of workers.
To enable the application of these coefficients, variables (and their names) were harmonized across the two datasets (the shock data and the input data). For greater consistency with NIDS-CRAM, where only one form of earnings was enumerated, an individual’s earnings matching their employment classification (self-employed or employee) was used for the final earnings variable (unless that form of earnings is zero and the other is positive).25 Some derived variables were created in the input data to match the shock data (e.g. a three-category race variable).
Because we cannot have missing values for April employment outcome in order for the SAMOD simulation to run, we find ways of imputing outcomes for those who were omitted from the multinomial logit because of missing data, and for February zero-earners. For those with missing occupation data (the majority of item-missing observations) we make assignments based on the predictions of a limited regression excluding occupation. For those who remain missing (due to other variables), random assignment is performed based on mean probabilities of entering each state from the full multinomial logit. Finally, pre-crisis zero-earners are classified as either furloughed or non-employed on the basis of a random draw (but remain zero-earners regardless).
Once this assignment has been performed, adjustments are made to individuals’ employment status and their earnings (at both the extensive and intensive margins). Those assigned to the employed group saw no change to their earnings, whereas those assigned to the not-employed or furloughed groups had their earnings and hours worked set to zero. For those assigned to the group that is still employed but with reduced earnings, mean earnings were reduced proportionally within sex and race subgroups in line with the mean proportional earnings reduction in corresponding NIDS-CRAM subgroups (among those reporting a drop in earnings).26
Table C2 shows estimated earnings reductions of between 27 and 41 per cent. Note that the sample sizes for these estimates were very small (around 30) for Coloured/Asian/Indian and White subgroups, but were much larger for African groups. In addition, across all subgroupings the degree of uncertainty in these estimates was very large (with standard errors of around 30 percentage points).
| Mean earnings reduction (%) | Standard error | n | |
|---|---|---|---|
| African males | 27.7 | 30.34 | 200 |
| Coloured/Asian/Indian males | 40.49 | 27.07 | 27 |
| White males | 39.62 | 32.22 | 29 |
| African females | 23.92 | 27.2 | 228 |
| Coloured/Asian/Indian females | 33.54 | 32.24 | 33 |
| White females | 40.83 | 30.73 | 27 |
Source: Authors’ calculations based on NIDS-CRAM and SAMOD data.
Note: These proportions are estimates of the extent of the reduction in earnings among those who faced earnings reductions. A 15 per cent threshold was used for earnings reductions.
Having applied these earnings changes (at both the extensive and intensive margins), we compared the distribution of earnings in the simulated post-shock data to the actual distribution in NIDS-CRAM (results not shown). Unlike NIDS-CRAM earnings, which increased at the mean among positive earners between February and April (likely due to composition effects), our simulation of earnings changes led to a decrease in mean earnings.
This simulated distribution of individuals in the different employment categories was then compared to estimated totals from NIDS-CRAM (Table C3). We also compared modelled and actual employment outcomes for those in the input dataset who were also surveyed in NIDS-CRAM (Table C4).
| NIDS-CRAM April employment outcome | Simulated April employment outcome in SAMOD | |||||
|---|---|---|---|---|---|---|
| Estimated percentage | Estimated total | N | Estimated percentage | Estimated total | N | |
| Employed with no drop in earnings | 51.13 | 9,386,097 | 1,718 | 53.71 | 8,875,967 | 5,333 |
| Employed with a drop in earnings | 12.24 | 2,247,465 | 411 | 14.21 | 2,348,882 | 1,411 |
| Furloughed | 11.88 | 2,181,499 | 399 | 11.51 | 1,902,303 | 1,143 |
| No longer employed | 24.75 | 4,543,719 | 832 | 20.56 | 3,397,428 | 2,041 |
Source: Authors’ calculations based on NIDS-CRAM and SAMOD data.
| Simulated April employment outcome (SAMOD) | |||||
|---|---|---|---|---|---|
| Actual April employment outcome (NIDS-CRAM) | Employed with no drop in earnings | Employed with a drop in earnings | Furloughed | No longer employed | Total percentage (N) |
| Employed with no drop in earnings | 57.04 | 15.21 | 8.47 | 223 | 100 (N = 1157) |
| Employed with a drop in earnings | 55.97 | 13.58 | 9.05 | 21.4 | 100 (N = 243) |
| Furloughed | 49.37 | 15.06 | 13.81 | 21.76 | 100 (N = 239) |
| No longer employed | 47.81 | 13.36 | 12.73 | 26.1 | 100 (N = 479) |
Source: Authors’ calculations based on NIDS-CRAM and SAMOD data.
In general, this method yielded an overall distribution of simulated April outcomes that was similar to the distribution of actual April NIDS-CRAM outcomes. This means we are capturing the general picture in terms of April employment outcomes well. However, beyond this there was not as much correlation between actual and simulated outcomes as one would hope (probably because of a lack of predictive power in the model in general). This means that many people will have a simulated April outcome that is different to their actual outcome as represented in NIDS-CRAM. However, since not all individuals in the NIDS microsimulation baseline data were included in NIDS-CRAM, predictions cannot be avoided. Therefore, we chose to use the predicted employment status for all observations to have a harmonized treatment across all individuals and households in the dataset underpinning the microsimulation model.
It is also important to understand transitions by race and education level. Tables C5 and C6 show the proportions of individuals (employed in February) in different race and education groups transitioning into different employment states, in NIDS-CRAM and in the SAMOD data, respectively.
| April employment outcome (%) | ||||
|---|---|---|---|---|
| Employed with no drop in earnings | Employed with a drop in earnings | Furloughed | No longer employed | |
| Race | ||||
| African | 49.2 | 10.69 | 13.38 | 26.72 |
| Coloured/Asian/Indian | 55.65 | 13.22 | 6.94 | 24.19 |
| White | 58.86 | 21.34 | 7.38 | 12.43 |
| Education level | ||||
| Less than matric | 46.61 | 9.63 | 14.12 | 29.64 |
| Matric | 48.84 | 12.08 | 9.03 | 30.05 |
| More than matric | 56.23 | 14.46 | 11.77 | 17.54 |
Source: Authors’ calculations based on NIDS-CRAM data.
Table C5 shows that in NIDS-CRAM, those with higher education were less likely to lose employment or become furloughed, but more likely to face a reduction in earnings relative to less-educated groups. They also had the highest rates of remaining employed with no drop in earnings. In contrast, an estimated 30 per cent of those with less than matric lost employment. Outcomes by race followed a similar pattern, with White individuals more likely to remain employed (and also to face reduced earnings) and less likely to become furloughed or lose employment, and the highest rates of employment loss and furloughing among Africans.
The transitions in the SAMOD simulation (Table C6) show that there was much less heterogeneity in employment outcomes by race and education relative to NIDS-CRAM, and that the differences in outcomes along these dimensions (and education in particular) are underestimated in these modelled outcomes. However, some important patterns, such as Africans being more likely to be furloughed or lose employment, and Whites being more likely to retain employment with a reduction in earnings, were replicated in the simulation.
| April employment outcome (%) | ||||
|---|---|---|---|---|
| Employed with no drop in earnings | Employed with a drop in earnings | Furloughed | No longer employed | |
| Race | ||||
| African | 53.43 | 11.83 | 12.57 | 22.17 |
| Coloured/Asian/Indian | 56.27 | 16.85 | 8.61 | 18.27 |
| White | 53.06 | 24.21 | 6.8 | 15.93 |
| Education level | ||||
| Less than matric | 51.48 | 11.23 | 13.47 | 23.81 |
| Matric | 50.7 | 17.31 | 6.09 | 25.9 |
| More than matric | 58.4 | 15.21 | 12.12 | 14.27 |
Source: Authors’ calculations based on SAMOD data.
Finally, Table C7 compares aggregate employment status in NIDS-CRAM and in the SAMOD simulation.
| NIDS-CRAM Wave 1 (April) | SAMOD April simulated estimates | |||
|---|---|---|---|---|
| Estimated total | Estimated proportion | Estimated total | Estimated proportion | |
| NEA | 7,872,015 | 22.44 | 12,931,312 | 32.94 |
| Unemployed | 11,564,228 | 32.96 | 13,277,751 | 33.82 |
| Employed | 15,648,103 | 44.6 | 13,050,449 | 33.24 |
| Total | 35,084,347 | 100 | 39,259,512 | 100 |
Source: Authors’ calculations based on NID-CRAM and SAMOD data.
Note: Based on a sample of individuals aged 18 and above. NEA, not economically active.
The estimated share and number of employed were a lot lower in SAMOD relative to NIDS-CRAM. NIDS-CRAM has an estimated employment rate of 45 per cent relative to 33 per cent in the SAMOD data. This is probably driven by the calibration to the QLFS labour market profile, which generally has lower estimates of employment, and by the fact that only job loss and not job gain (between February and April) were modelled. Unemployment rates were similar across datasets, while estimated economic inactivity was a lot higher in SAMOD relative to NIDS-CRAM. Finally, as a consequence of the way SAMOD was weighted, the total estimated population was substantially larger in SAMOD relative to NIDS-CRAM.
References
- Bassier, I, Budlender, J, Zizzamia, R, Leibbrandt, M, Ranchhod, V (2021). Locked down and locked out: Repurposing social assistance as emergency relief to informal workers. World Development, 139 . https://doi.org/10.1016/j.worlddev.2020.105271
- Brewer, M, Tasseva, I (2020). Did the UK Policy Response to COVID-19 Protect Household Incomes?’ EUROMOD Working Paper EM12/20.
- Casale, D, Posel, D (2020). Gender and the early effects of the covid-19 crisis in the paid and unpaid economies in South Africa. NIDS-CRAM report.
- (2020). Unemployment and labour on UIF coronavirus covid-19 TERS payments. Media statement.
- Dolls, M, Fuest, C, Peichl, A (2012). Automatic stabilizers and economic crisis: US vs. Europe. Journal of Public Economics, 96 , 279–294. https://doi.org/10.1016/j.jpubeco.2011.11.001
- Ingle, K, Brophy, T, Daniels, RC (2020). National Income Dynamics Study: Coronavirus Rapid Mobile Survey (NIDS-CRAM) Panel User Manual. Version 2. Cape Town: Southern Africa Labour and Development Research Unit.
- Jain, R, Budlender, J, Zizzamia, R, Bassier, I (2020). The labour market and poverty impacts of COVID-19 in South Africa. NIDS-CRAM paper.
- Jara, HX, Montesdeoca, L, Tasseva, I (2021). WIDER Working Paper 4/2021.
- Ranchhod, V, Daniels, R (2020). Labour market dynamics in South Africa in the time of COVID-19: Evidence from wave 1 of the NIDS-CRAM survey. NIDS-CRAM paper.
- (2020). Government Gazette.
- Rogan, M, Skinner, C (2020). The Covid-19 Crisis and the South African Informal Economy: “Locked Out” of Livelihoods and Employment. NIDS-CRAM Paper.
- (2017). National Income dynamics study: Wave 5 (dataset). Version 1.0.0. Cape Town: SALDRU.
- (2020). 29 September quarterly Labour Force survey (QLFS) – q2: 2020. Press Statement.
- Sutherland, H, Figari, F (2013). EUROMOD: The European Union tax–benefit microsimulation model. International Journal of Microsimulation, 6, 4–26. https://doi.org/10.34196/ijm.00075
- (2019). EUROMOD software v3.1.8. Colchester: University of Essex.
- Wilkinson, K (2009). Adapting EUROMOD for Use in a Developing Country: The Case of South Africa and SAMOD’. EUROMOD Working Paper EM5/09. Colchester: University of Essex.
- Wright, G, Noble, M, Barnes, H, McLennan, D, Mpike, M (2016). WIDER Working Paper 2016/115.
- Zizzamia, R, Jain, R, Budlender, J, Bassier, I (2020). The Labor Market and Poverty Impacts of COVID-19 in South Africa’. CSAE Working Paper 2020-14. Oxford Centre for the Study of African Economies.
Article and author information
Author details
Funding
The study was originally commissioned under the UNU-WIDER project Southern Africa – Towards Inclusive Economic Development (SA-TIED).
Acknowledgements
An earlier version of this paper was published as WIDER Working Paper 68/2021 https://doi.org/10.35188/UNU-WIDER/2021/006-1
Publication history
Copyright
© 2021, Barnes et al.
This article is distributed under the terms of the Creative Commons Attribution License, which permits unrestricted use and redistribution provided that the original author and source are credited.