
Jump to
1. Introduction
The ageing of the population has been identified as one of the most critical policy challenges facing governments in the industrialised world (OECD, 1996). Governments everywhere have become deeply concerned about the ageing of the baby boomers and the enormous fiscal strains that they may generate during the next 50 years. A key issue is the likely private incomes of future retirees and the extent to which governments will be willing and/or able to support the living standards of retirees, through the provision of the age pension, subsidised health care, and so on. The need for governments to urgently make decisions in this regard is highlighted by the fact that the first of the baby boomers are turning 55 this year. From this year on, they may begin to enter their retirement and access their superannuation funds.
In such debates, the future fortunes of women loom large. Women are widely acknowledged to be a particularly vulnerable group, because:
women are more likely than men to work part-year, part-time or in casual positions (eg. in October 2000, 43% of female employees worked part-time, compared with only 13% of male employees);
even when they work full-time, women’s average earnings amount to only 84 per cent of male average full-time earnings; and
women are more likely to have interrupted labour force careers, due to child bearing and rearing (with women currently spending 17 years on average in the paid labour force, compared to 39 years for men – Clare, 1994).
The result is that for many women, as contributions are usually linked to earnings, they will accumulate substantially less superannuation than men. The male members of superannuation funds, for example, already enjoy assets almost three times greater than the female members (Goward, 1997, p. 3). There is also concern that occupational superannuation and social security policy are not well integrated, with the Superannuation Guarantee Charge (SGC) possibly being of marginal benefit to women if it simply replaces the age pension (Knox, 1994). An additional major issue is the treatment of superannuation upon divorce where, typically, divorce has a very detrimental effect upon a women’s future retirement income. Many women who are at home raising children or working in low-paid part-time jobs assume that they will enjoy a comfortable retirement because of their husband’s superannuation. But now that one-third of marriages end in divorce, for a very substantial proportion such an assumption may not prove correct.
The financial situation of women in retirement is thus a major public policy issue. There is concern that a significant proportion of female retirees this century will receive age pensions, and possess little or no private assets or income. There is concern about the likely cost of such support to the taxpayer, particularly as the ageing baby boomers can be expected to also generate significant public health costs. If fiscal pressures upon the government increase, the extent to which any shift from public to private support is feasible will depend critically upon the future incomes and assets of the aged, and the willingness of the aged to draw upon them to meet their own needs.
Given its recognised importance to public policy, it is not surprising that the past decade has seen continuous policy reform in this area, most notably the introduction of the compulsory SGC, which has spread superannuation across the workforce. The past decade has also seen the development of a range of highly sophisticated models for predicting future retirement incomes, particularly by the Retirement Income Modelling (RIM) Task Force (now RIM Unit) established within the Commonwealth Treasury.
Those models established to date do not, however, provide the best tools to answer questions about the future retirement incomes of women. In particular, they are unable to cope with the impact of divorce. In addition, while they provide a very general overview of the future distributional picture - by age, gender and decile of career income - they are not well able to capture diversity or the experiences of smaller population sub-groups. Thus, they are not able to answer questions about the likely retirement incomes of women who take up part-time jobs for long periods of time because they are sole parents.
This paper discusses the initial results coming from a dynamic microsimulation model developed at NATSEM. The model, which has been in development for a number of years, has recently added a superannuation module to enable questions like those above to be answered and to shed light on the future financial situation of women (and men) in retirement. This dynamic model, DYNAMOD, provides detailed distributional estimates of the impact of policy and other changes and of the likely degree of dispersion in future retirement wealth. The development of the superannuation module is being done at NATSEM with support from an Australian Research Council grant (A79906127).
2. The model
2.1 Possible modelling techniques
There are a number of modelling techniques that could be used to project the financial situation of retired women. These include hypothetical models, group models and dynamic microsimulation models.
2.1.1 Hypothetical models
Hypothetical models analyse the situation of an individual, whose particular characteristics are defined by the model user. Thus, a hypothetical model might look at the future superannuation of a single woman earning average earnings and working full-time for 20 years and part-time for 20 years. Such models are very useful for analysing policy outcomes for particular types of individuals and can incorporate enormous detail. However, such models cannot be used to obtain estimates of aggregate budget outcomes or distributional outcomes for the whole population.
2.1.2 Group models
Group models divide the population into a set of groups defined by characteristics such as year of birth, sex, marital status and labour force status (Rothman, 1996; 1997). The extent of diversity is thus effectively constrained by the number and type of groups specified. Moreover, there is usually no scope for people in the model to move from one group to another. As a result, such models cannot cope with divorce. They also cannot cope with fluctuating individual earnings over a lifetime, with people being assigned to a lifetime earnings group and then experiencing the average outcomes for their group. Thus, group models provide details of the average experience for each of the groups specified within the model.
2.1.3 Dynamic microsimulation models
Dynamic microsimulation models are a relatively new type of model that can provide both detailed distributional answers and profiles for small population sub-groups (such as sole parents), as well as aggregate budgetary estimates. The key to this type of modelling is that individuals form the basis of the model and that such individuals make up a representative sample of the population. This means that the individuals within the model retain the diversity of experiences apparent in the real world – but that conclusions can still be drawn for all of Australia. Such models thus embody the key advantages of the hypothetical and group models, but do not suffer from their major disadvantages.
2.2 DYNAMOD
NATSEM has developed a dynamic microsimulation model to show the implications of policy outcomes on individuals while being able to provide aggregate and average results. The dynamic model, DYNAMOD, begins with the 1986 Australian Bureau of Statistics (ABS) one per cent Census sample file. Onto the individuals on this file are imputed additional characteristics (such as more detail on the level and type of education being undertaken, the state in which the person lives, the value of the family home, etc). The result is a base population of 150,000 synthetic individuals with over 80 characteristics each. The model takes this base population and simulates their lives from 1986 onwards, by stepping month-by-month through time until the middle of the 21st century. As the individuals step through life, they experience a range of life events, in line with Australian data about the probabilities of those events happening to real Australians. The life events include death; fertility; couple formation and dissolution; emigration and immigration; primary, secondary and tertiary education; labour force changes (full and part-time employment, unemployment and NILF), disability onset and recovery, and the earning of income.
These individuals are the “micro” part of the simulation. Analysis of any aspect of their lives can be done at this micro level. Additionally, individuals in the model are linked to simulate couple formation and the links broken to simulate couple dissolution. Links are maintained between parents and their children and between current and ex-spouses. In this manner, the model maintains the diversity in the population, copes very well with couple formation and dissolution, and, importantly, allows generation of a longitudinal history (or future) for individual cases in the model. This longitudinal element is essential in order to capture the accumulation processes that underlie growth in superannuation and financial assets. Alternative futures can be simulated by varying particular probabilities, such as the chance of becoming full-time employed or of having a first child, given certain characteristics. The model also contains a capacity to make the summed outcomes for all individuals within the model fit some exogenously imposed total. For example, the proportion of all women of a certain age range that are to be employed full-time in 2010 can be set by the user.
A wide range of technical papers provides detail of the processes used in DYNAMOD (detailed overviews are provided in Antcliff, 1993 and King et al., 1999). The latest version of the dynamic microsimulation software is DYNAMOD-3. This version adds life events relating to paying income tax, accumulating and diluting personal and family wealth assets and contributing to superannuation. It is this version and its outcomes that are discussed throughout the remainder of the paper.
2.3 The Superannuation Module
Superannuation is a recent addition to DYNAMOD and this module promises to provide very detailed estimates of those who have superannuation and the amounts that are held. The accuracy of the modelling, naturally, depends on the availability of good quality data. For dynamic microsimulation there is an additional need and that is for very detailed and preferably longitudinal or panel data. Unfortunately the data available on superannuation holdings in Australia are limited. A significant step forward will be the release later this year of the confidentialised unit record or micro data from the 2000 ABS superannuation survey. At the present time, the major source of superannuation asset data is a survey of major private superannuation funds conducted by RIM in the early 1990s (Brown, 1994). This data collection, combined with ABS survey data, provides the foundation of superannuation asset modelling in DYNAMOD.
Superannuation is simulated from 1993 onwards. There is both RIM and ABS data available for that year. RIM, through its data collection and research, has estimated the average amounts held in superannuation in 1993 while ABS undertook a survey of superannuation coverage in that same year. The ABS data shows who had a superannuation account in 1993, while the RIM data indicates the balance of the account at that time. The simulation uses this coverage and account balance information to impute an initial superannuation amount onto individuals.
From 1993 onwards, a variety of transactions take place:
Contributions equivalent to employer contributions are deposited into a person’s account as income is earned;
A person may choose to make voluntary contributions into their superannuation account;
Interest is paid on the account balance; and
Accounts can be closed and the balance transferred into another type of account on retirement.
For reasons of practicality, the full complexity of superannuation could not be modelled and some areas were simplified. In some other areas assumptions had to be made as actual data were not available. The assumptions and simplifications include:
The reduction of fund types to only one – the Accumulation Fund. This is the most common type of fund (87% of superannuation membership is of this type);
Employer contributions are made for all employees at the superannuation guarantee charge (SGC) rate. In line with the legislation, the following are the only exceptions – individuals who are paid less than $450 per month; those employed but over 70 years old; and those employed but under 18 years old and not working full-time;
Employee and voluntary contribution percentages are based on the 1995 ABS survey data for 45-74 year-old employees. For others in the labour force an employee contribution of either zero or 5% is assigned;
Each person has only one account;
Withdrawal of funds before retirement is not permitted; and
All funds pay the same rate of return.
Each of these assumptions and their impact on the model is described in more detail in Appendix A.
Contributions to superannuation are made throughout the simulated working life of a person and interest is earned annually on funds invested in superannuation until retirement is reached, when the funds are transferred to the person’s cash account. The decision of a person to retire is done randomly but is based on probabilities derived from ABS data.
In the event of a divorce, the model currently includes superannuation in the division of family assets. After the division, the respective amounts are deposited back into each individual’s superannuation fund. In effect, DYNAMOD is enacting (a simplified version of) the legislation that is currently before the parliament.
3. Results
3.1 In General
Before using DYNAMOD to project outcomes in regard to superannuation, it may be appropriate to show that aggregate projections produced by the model agree with benchmark data. Unless a reasonable fit is achieved at this level, the credibility and usefulness of the model in regard to superannuation will be undermined.
Figure 1 is an example of the extent of concordance that is currently achieved between DYNAMOD projections for Australia’s population and ABS actual data and projections. The ABS projections are Series II.1 As can be seen at this aggregate level, the net effect of the simulation of mortality, fertility and migration is to reproduce a population total that closely matches the ABS data.
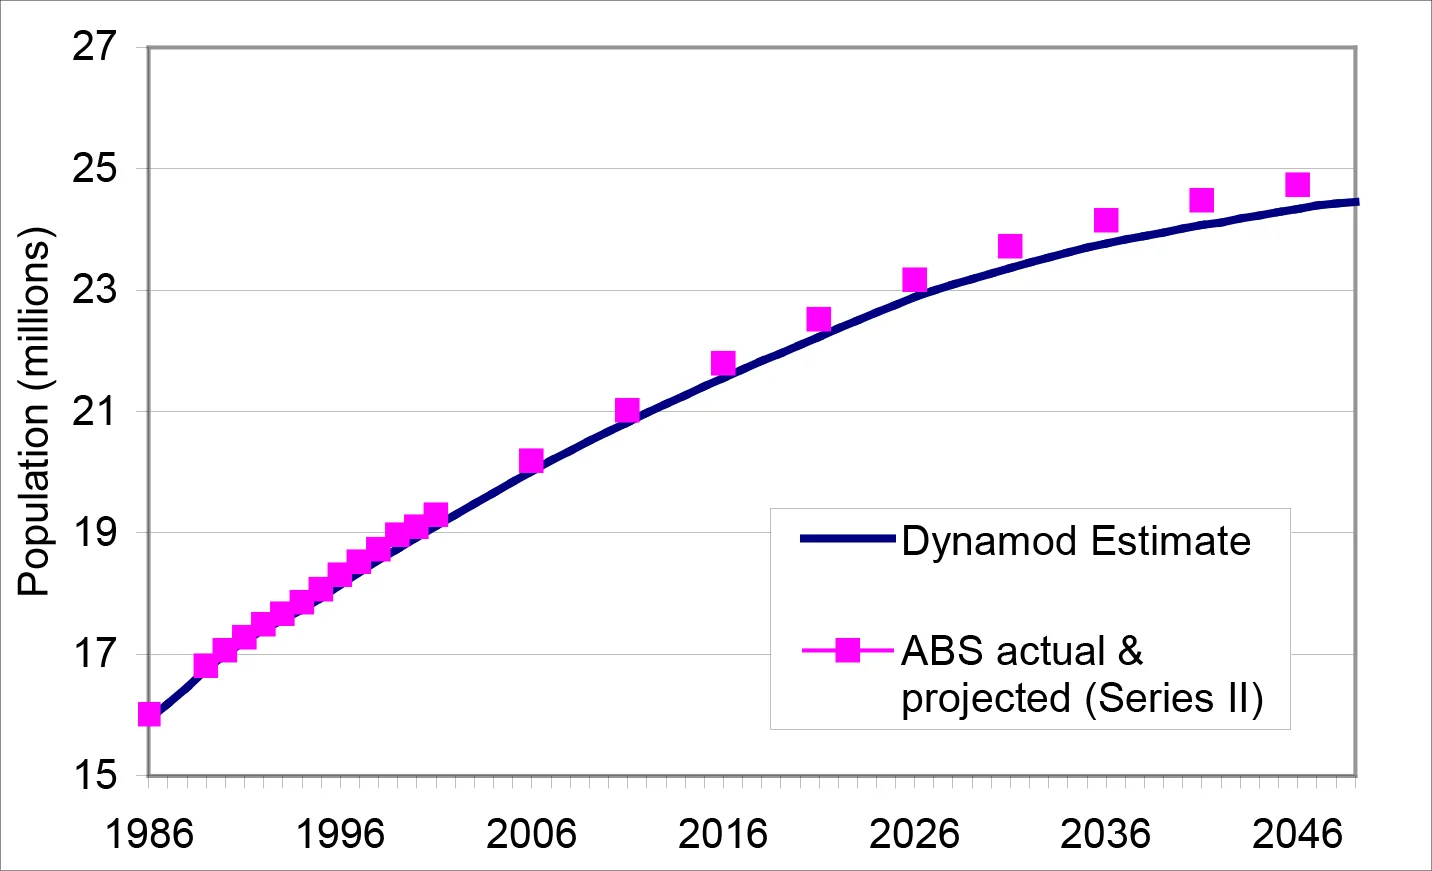
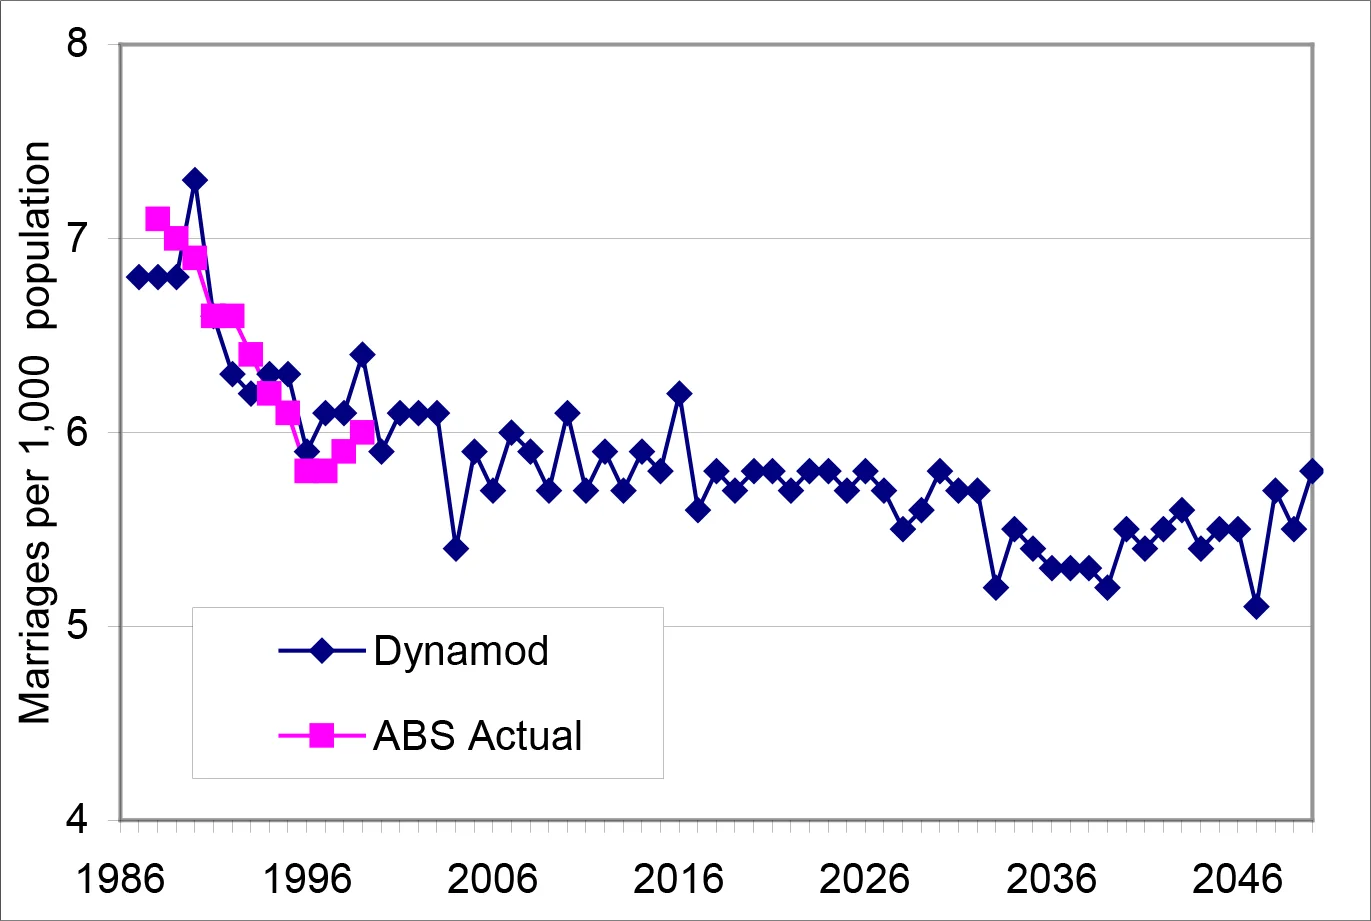
The alignment at this aggregate level is remarkable when you consider the different methodologies. ABS use a form of group modelling2 while dynamic microsimulation looks at the circumstances of every individual, every month, and decides whether they will become pregnant or not; whether they will continue to live or not; and whether they will emigrate or not. These are very different approaches and the closeness of the simulated aggregates with the ABS data suggests that the underlying modelling is capturing individual behaviour. A major advantage of dynamic microsimulation modelling is that we can now “drill down” into this aggregate data or we can group individuals together to look at collective or group outcomes. We could look at the retirement assets of an individual who marries at 25, divorces at 35, is diploma qualified, has two children, works in part-time employment for four years, and is employed full-time for ten years; we could compare women and men at various ages; or we could project the number of marriages per 1000 population (Figure 2). It is this flexibility that gives dynamic microsimulation a significant advantage over other techniques.
3.2 Superannuation
3.2.1 Aggregate Projection
The flexibility of dynamic modelling is seen again in an analysis of superannuation. Comparisons can be made at the aggregate level with exogenous benchmark data; comparisons by age, gender or marital status can be made; or the circumstances of a specific group of individuals can be examined. These comparisons could have an outcome in terms of superannuation coverage, annual changes in account balances, or balance at retirement. In Figure 3, DYNAMOD aggregate estimates for superannuation assets are compared with APRA and RIM estimates. The DYNAMOD estimates are in concordance with those estimated by RIM.
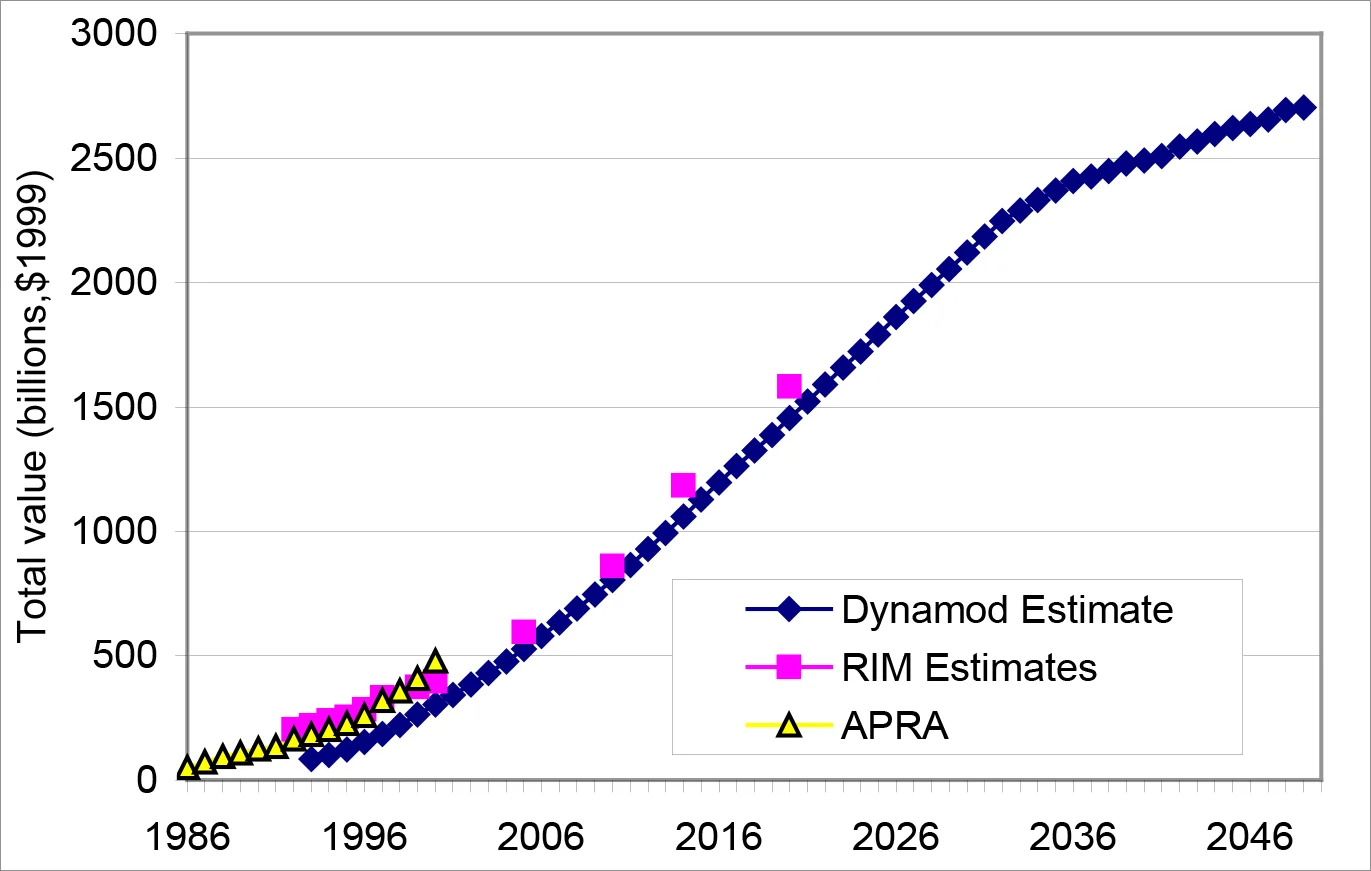
Around 2030, the last of the baby boomers will celebrate their 65th birthday. A good percentage of those still working will celebrate their birthday by ceasing employment and hence stop contributing to superannuation. The impact of this can be seen in the levelling of the growth in superannuation assets from this time onwards.
3.2.2 Coverage Projection
The level of superannuation coverage for both men and women has increased dramatically since the introduction of the three percent industrial award superannuation and then Superannuation Guarantee Charge (SGC) in 1992. The latter of these, with its compulsory employer contributions for every employee earning more than $450 per month, is having a dramatic impact on the coverage of superannuation. The ABS estimated in 1993 that 50.3 percent of all Australians aged 15 – 74 were covered by superannuation and 80.5 percent of those employed were covered. In 2000, ABS estimated 87.7 percent of people aged 15 to 54 with one or more jobs had superannuation coverage. While not directly comparable it does indicate the strong upward trend. Superannuation coverage simulated using DYNAMOD shows growth from an estimated 45.9 percent in 1993 to 84.4 percent in 2000 for all people aged 15 – 74 — again a very strong upward trend. Figure 4 shows the projected growth in coverage over the period 1993 to 2030. These figures cover all people aged 15-74 except full-time school students, rather than just those employed. A significant feature of these projections, done using DYNAMOD, is the estimate that by 2000 almost all people in some age groups were covered by superannuation. While the ABS estimates for 2000 are a little lower than this (the ABS estimates were in the low 90s), it is clear that SGC is well on its way to ensuring that everyone is covered by superannuation. The definition of ‘covered’ used in DYNAMOD means that anyone who has any amount in a superannuation fund is covered. It does not exclude those not currently making a contribution. (For example a person may contribute to superannuation while employed, then leave the labour force for a period to care for children.) Under the DYNAMOD definition the person is covered by superannuation. To qualify a person only needs to make one contribution (or have their employer make one contribution) and they are then regarded as ‘covered’ until retirement. In the real world, it is quite possible that a person has some superannuation from past employment but is not aware of it. This may have lead to some underreporting in the ABS data.
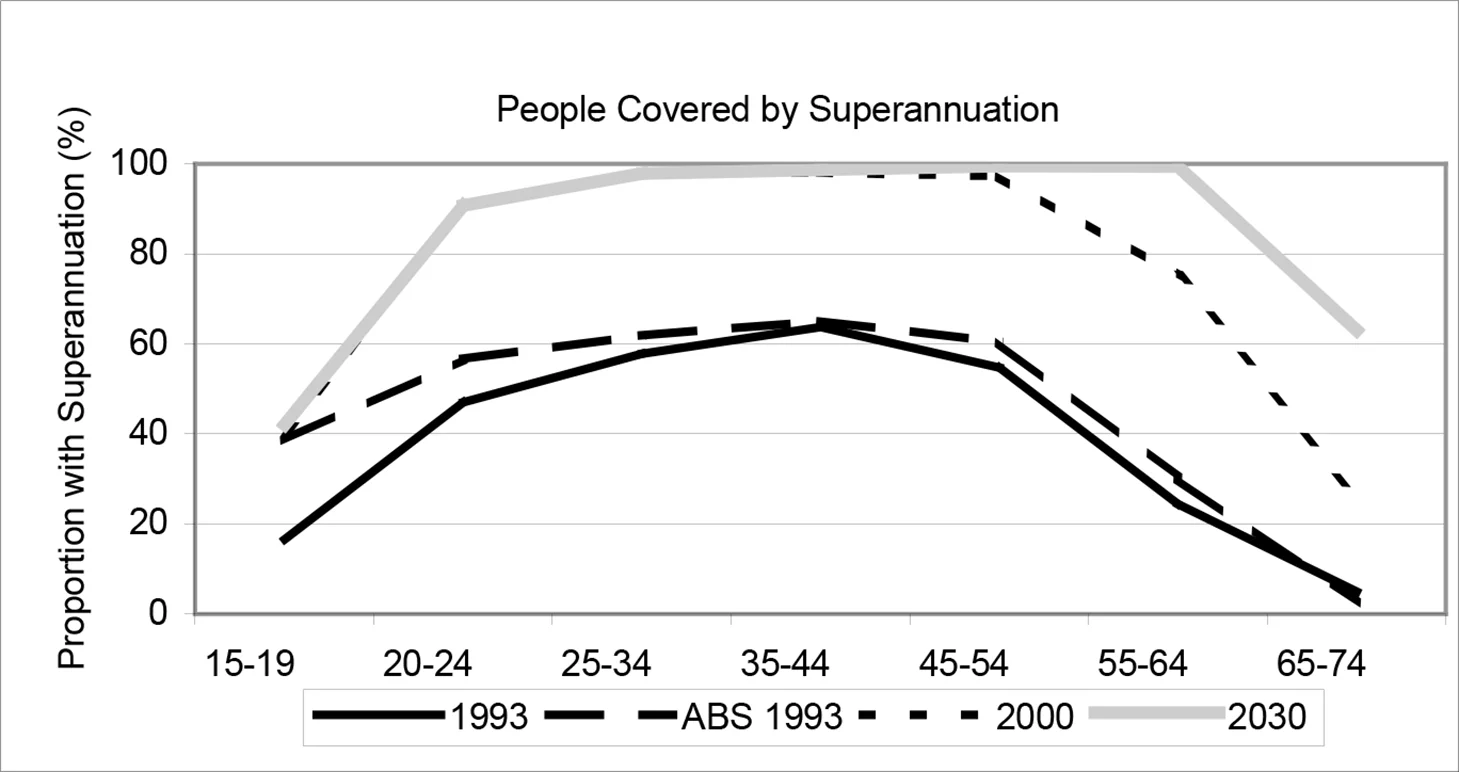
The compulsory nature of SGC makes the probability of achieving old age without ever earning more than $450 in one month remote and this is reflected in the figure below. It may not occur in 2000, but we are not far away from the day when every person will retire with some superannuation assets.
3.3 Average Superannuation Amounts
In a previous section the aggregate projected superannuation amounts were presented. In this section a more detailed look is taken at individual holdings. DYNAMOD begins simulating superannuation in 1993. In July of that year it allocated every person with superannuation cover an initial balance based on age and gender. In Table 1 this alignment by age and gender with the RIM data can be seen. The higher ‘All Ages’ value in DYNAMOD reflects the slight differences in spread of superannuation over the ages.
| RIM | DYNAMOD | DYNAMOD | DYNAMOD | |||||
|---|---|---|---|---|---|---|---|---|
| 1993 | 1993 | 2030 | % change 1993-2030 | |||||
| Age Group | Males | Females | Males | Females | Males | Females | Males | Females |
| ($) | ($) | ($) | ($) | ($) | ($) | (%) | (%) | |
| 15-19 | 2,237 | 1,488 | 2,237 | 1,488 | 2,046 | 1,422 | -9% | -4% |
| 20-24 | 3,911 | 2,767 | 3,911 | 2,767 | 8,030 | 5,319 | 105% | 92% |
| 25-29 | 7,798 | 4,739 | 7,798 | 4,739 | 25,220 | 15,987 | 223% | 237% |
| 30-34 | 12,930 | 6,093 | 12,930 | 6,093 | 52,149 | 30,064 | 303% | 393% |
| 35-39 | 19,588 | 7,792 | 19,588 | 7,792 | 91,403 | 48,877 | 367% | 527% |
| 40-44 | 26,606 | 9,761 | 26,606 | 9,761 | 139,752 | 74,269 | 425% | 661% |
| 45-49 | 35,646 | 12,709 | 35,646 | 12,709 | 201,778 | 109,832 | 466% | 764% |
| 50-54 | 44,712 | 16,905 | 44,712 | 16,905 | 281,115 | 155,452 | 529% | 820% |
| 55-59 | 55,688 | 23,993 | 55,688 | 23,993 | 352,794 | 196,930 | 534% | 721% |
| 60-64 | 71,731 | 35,194 | 71,731 | 35,194 | 389,926 | 193,374 | 444% | 449% |
| 65 & over | 75,424 | 25,976 | 75,424 | 25,976 | 397,204 | 194,837 | 427% | 650% |
| All Ages | 21,957 | 7,993 | 21,419 | 9,647 | 128,235 | 89,591 | 499% | 829% |
Source: RIM Conference paper 94/2 (Brown, 1994) and DYNAMOD, 2001.
All values in the table are in real 1999 dollars. The final four columns of the table show the estimated superannuation assets in 2030 and the percentage change 1993-2030. While the average superannuation amounts for women are well below those for men, there is a marked improvement over the period 1993 – 2030. The average female superannuation assets increase from 45% of the average male in 1993 to 70% in 2030.
3.4 Women in Retirement
In the introduction the ageing of the population and the future fortunes of women were discussed. An analysis of ABS population projections highlights both the ageing of the population and its impact on women.
3.4.1 Ageing
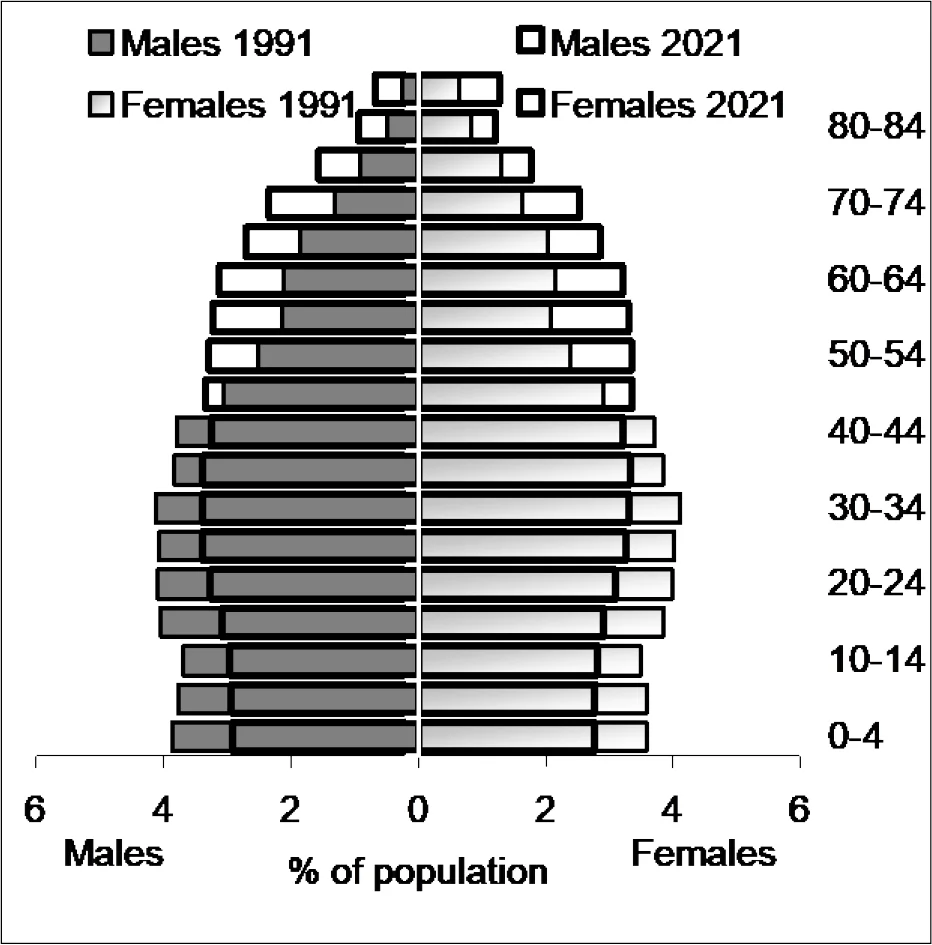
In Figure 5 and 6 significant change to the Australia age profiles can be seen. In the two comparisons, the population in 1991 (dark colour) is compared with 30 and 60 years later, while the percentage of the population is presented in five year age groups from 0 to 85 and 85+. In 1991 the largest groups were the three groups covering ages 20-35 (ie born from 1956-1971), with a fairly clear decrease in the percentages above that age. The age group 85+ represented only 0.9% of the population (0.25% males and 0.63% females). By 2021 the peak age groups will have flattened and become broader. The 1991 Christmas tree shape has transformed into a more rectangular one. There is now a fairly even distribution of people between the ages of 20-65. The average age has increased and the proportion aged 85+ has more than doubled to 2.0%.
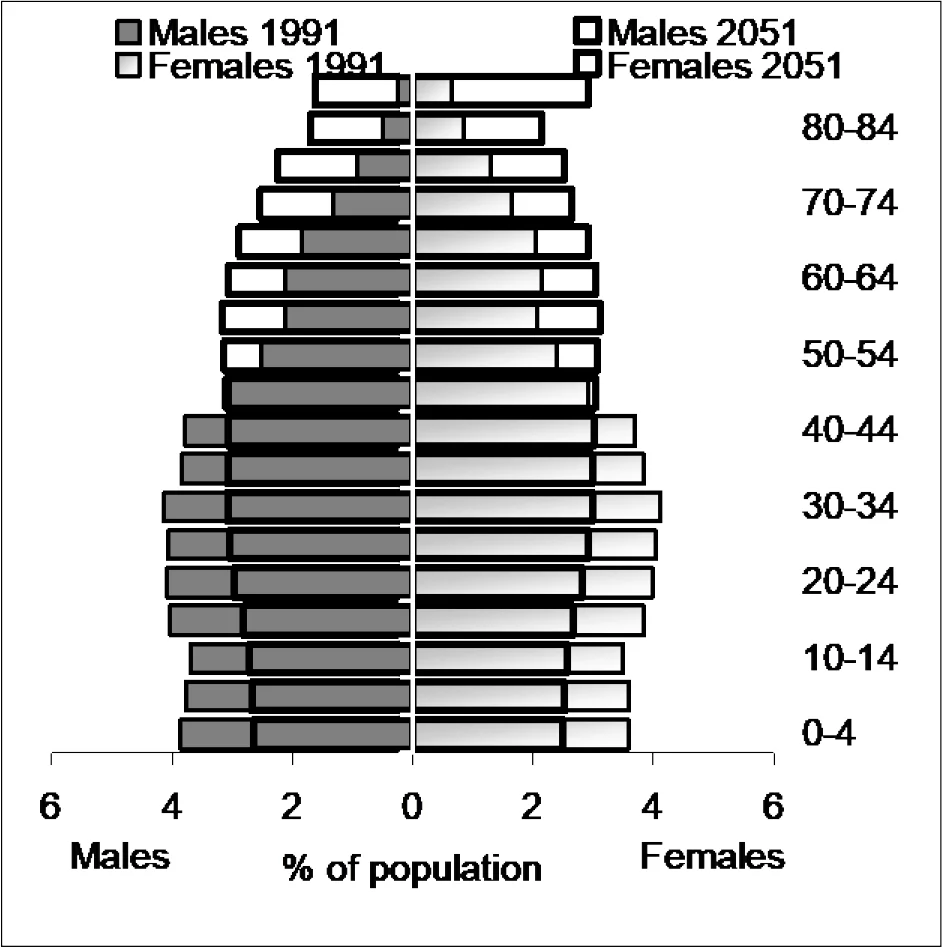
By 2051, as seen in Figure 6, the age groups over 40 contain the higher proportions of people and the rectangular shape is beginning to be replaced by an inverted pyramid. The 85+ population has now become quite significant, representing 4.5% of the population, with almost two out of three of those aged 85+ being women (64.2%).
In the space of only 60 years, from 1991 to 2051, a population with the majority aged below 40 years will be supplanted by a population dominated by people aged over 40 — while the proportion aged over 85 will have increased five fold.
The five-fold increase in people aged 85+, along with the significant increase in the proportion aged 65 and over (increasing from 11% in 1991 to 24% in 2051), will result in greatly increased medical costs and nursing requirements. These costs and requirements are going to continue to grow and place an increasing burden on people’s own financial resources, their relatives and/or on the government. The five fold increase in women aged 85+ makes them vulnerable to bearing a high proportion of this cost.
In summary, the proportion of people aged 85+ will increase five fold by 2051 and women will represent two-thirds of the people in this age group. The proportion aged 65+ will increase to 24 percent of the population.
3.4.2 Trends in Marital Status
The ageing of the population will impact on women but a number of other changes will also have an impact. One of these is the trend towards later marriage. Figure 7 shows the forecast decrease in the proportion of females married in the two age groups up to age 35 and the higher proportion of females married in their 40s and beyond. The ABS estimate that the median age for women at first marriage has increased from 24.0 years in 1988 to 26.2 in 1998. The median age for women at remarriage has also increased, from 35.3 to 38.4 over that period (ABS 4102.0). These trends are reflected in the declining proportion of younger women who are married.
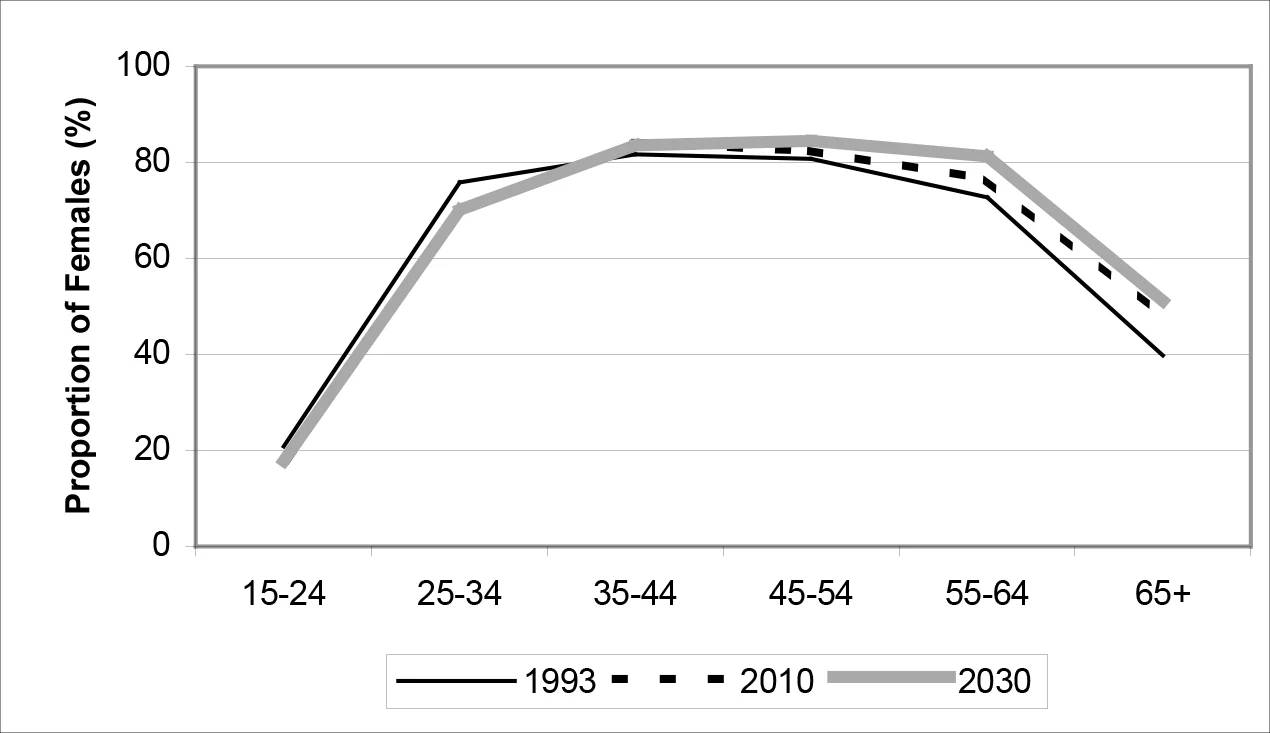
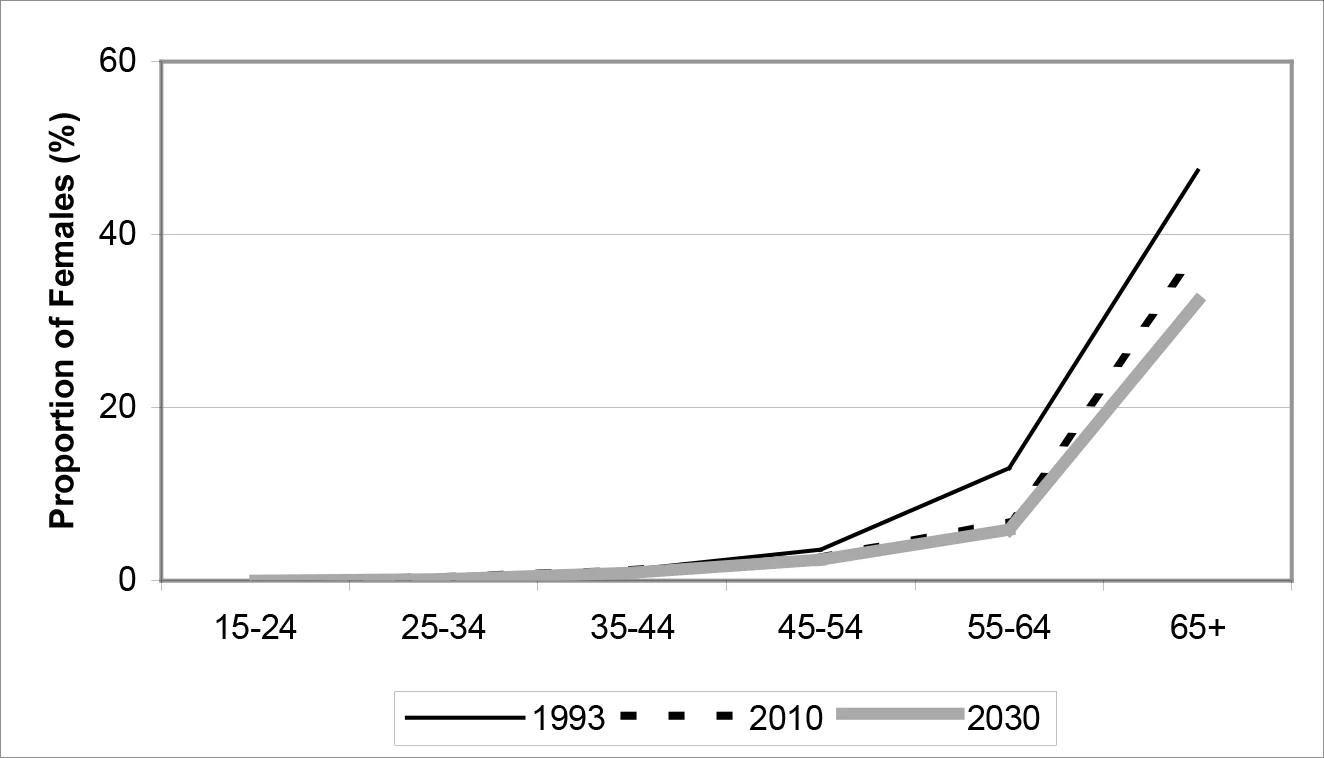
There are two possible reasons for the increased proportion of women married at ages 40 and above. The first is that since marriage started at an older age, it will finish at an older age. The assumption here is that marriages are of the same duration. In fact, the duration of marriages increased slightly over the period 1988-98 – by 0.5 years to 7.8 years (ABS 4102.0). The end result of getting married 2-3 years later and the marriage lasting 6 months longer would have the impact of moving the age distribution curve to the right as we see in Figure 7. A second or alternative reason for the movement in the curve is the ageing discussed in the previous paragraph. While on average women still outlive men, the ageing of both genders causes wives to become widows at a later age. This trend can be seen in Figure 8. The proportion of females who are widows decreases between 1990 and 2030/2050.
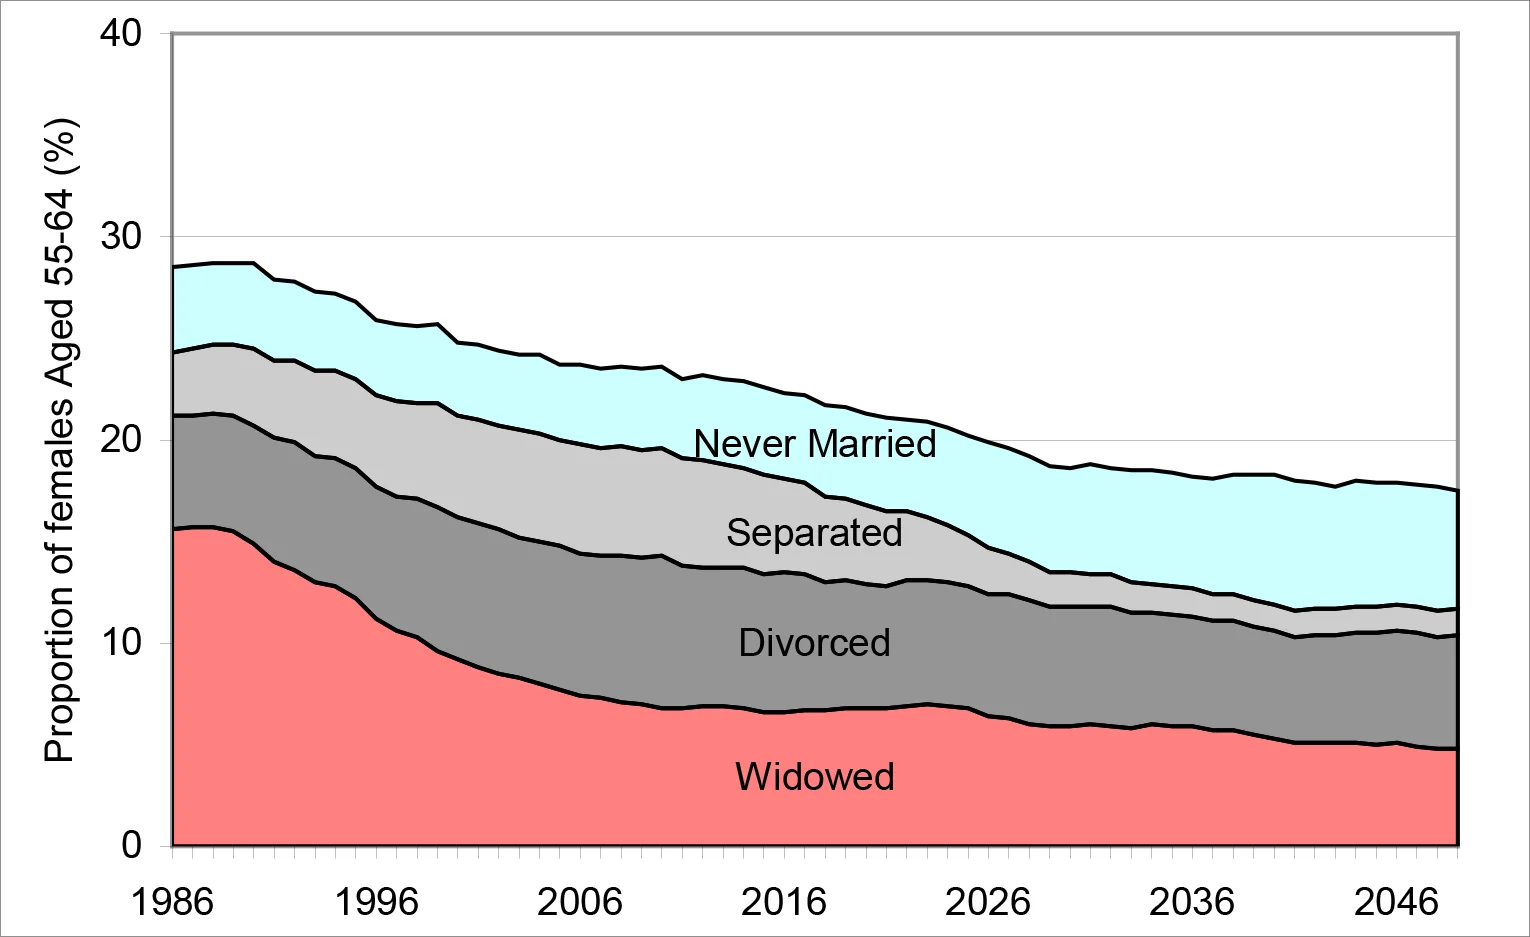
An alternative view of the changing marital status of women around retirement age is presented in Figure 9. The figure shows the outcomes produced by DYNAMOD for women aged 55 – 64 over the period 1986 – 2030. Each colour represents the proportion of women in this age group with that particular status. The proportions are cumulative, with the proportion not shown being married women (de jure or de facto). As an example, in 1986 28% of women aged 55-64 have a marital status other rather “Married’, while the remaining proportion (72%) are married. The figure therefore shows an increased proportion married over the period 1986-2030. A decrease in the “widowed” proportion is also evident.
3.5 Women in the Labour Force
The labour force participation of men and women is markedly different. Women have always been more likely to be employed part-time. In 1999 the proportion of women employed part-time was 43.5 percent, while for men it was only 12.5 percent (ABS 4102.0 pp.108). This wide disparity was evident throughout the 1990s, despite a significant growth overall in part-time employment for both genders (the overall proportion employed part-time rose from 20.9% in 1990 to 26.0% in 1999). Labour force participation rates are also quite different when compared on a gender basis. The female participation rate rose by to 2.0 percentage points to 53.9 percent in the 1990s while the male participation rate fell 2.7 to 72.8 percent over the same period. In some age groups the difference was even greater. For example, the participation rate trend for 55-59 year old men is slowly downwards (from 75.0% to 73.2% in the 1990s), while the trend for women of the same age is rapidly upwards (up from 32.4% at the start of the 1990s to 43.6% at the end) (ABS 4102.0 pp. 109).
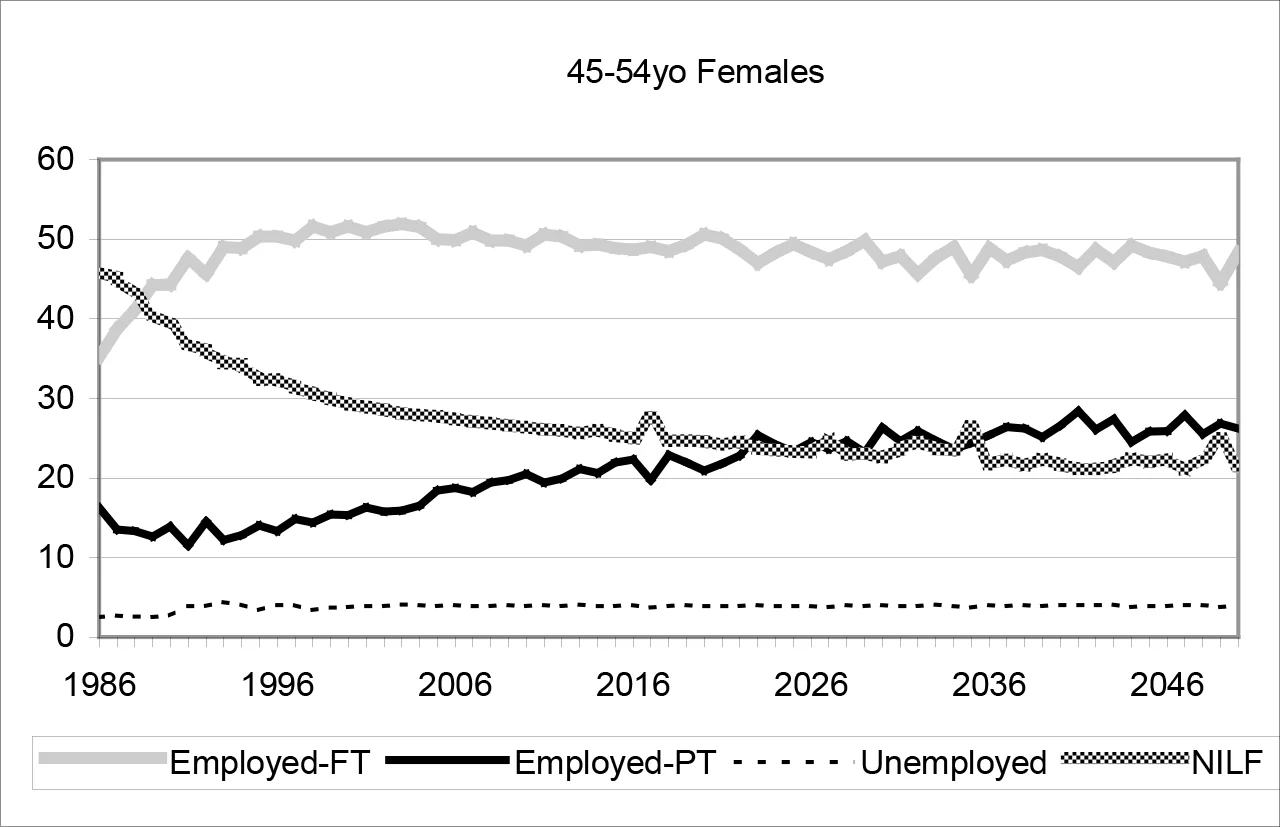
Overall, female labour force participation and the type of employment are changing. The proportion not in the labour force is falling and the proportion in part-time employment is rising. Both DYNAMOD projections and ABS actual data suggest that some of the part-time rise may be at the expense of full-time but most is coming as a result of choosing to participate in the labour force on a part-time basis rather than not participate at all.
An advantage of dynamic microsimulation is that these differences can be easily handled. The decision to participate in the labour force or to change employment status is done at the individual level — and hence the influences on the decision are applied at this level and can vary over time.
A different way of looking at the labour forces changes is to consider a particular group over a period of time. This is done for females aged 45-54 in Figure 10. The decreasing proportion not in the labour force is evident, along with the increasing proportion in part-time employment. The growth in part-time comes mainly from females entering or re-entering the workforce (the decreasing proportion NILF) but there is a small impact on the full-time participation as well. A slight decrease in females employed full-time can be seen from 2000 onwards which is perhaps a reflection of the desire to be in the labour force yet still have time for other things.
3.6 Women and Superannuation
To accumulate superannuation assets a person must have superannuation coverage. As discussed in the section Coverage Projection (page 11) almost everyone will have had superannuation contributions made on their behalf by retirement because of the government’s SGC policy. The amount that will be held in this superannuation account will depend on three factors – the rate of return of the superannuation fund, the contributions made into the account, and taxation on the superannuation. The last of these, taxation, is not part of NATSEM’s modelling at this stage. The SGC employer contributions are a percentage of earnings, the higher the earnings and the longer the time in employment, the greater the superannuation assets. In most cases a working life spent in full-time, high salary employment and not interrupted by any periods of unemployment or NILF would produce the highest superannuation. This set of circumstances is most likely to achieved by males — and it is for this reason that average female superannuation amounts were only 45% of those of males in 1993. However, the increasing age of marriage and childbirth, reduced periods of NILF for child raising purposes, and the increased use of part-time employment are having a positive effect. Female superannuation is increasing as a proportion of male superannuation, and is estimated by DYNAMOD to reach 70 percent by 2030. Unless there is complete equality in the labour force roles, the female proportion will remain lower than the male, due partly to lower female earnings and different workforce participation patterns in the child bearing and rearing years.
The estimated amounts of superannuation held by various age groups of women are shown in Figure 11. The impact of compound growth is evident in the figure. In 1993 few women had contributed to superannuation in the early part of their working life and hence the balance in their superannuation account did not grow through interest being paid and added each year. In comparison, by 2030 most women will have made superannuation contributions at the start of their working life. For the next 30-40 years that contribution will have been added to each year through interest. This, combined with more years of employment than the previous generation’s, results in exponential growth in the value of the asset.
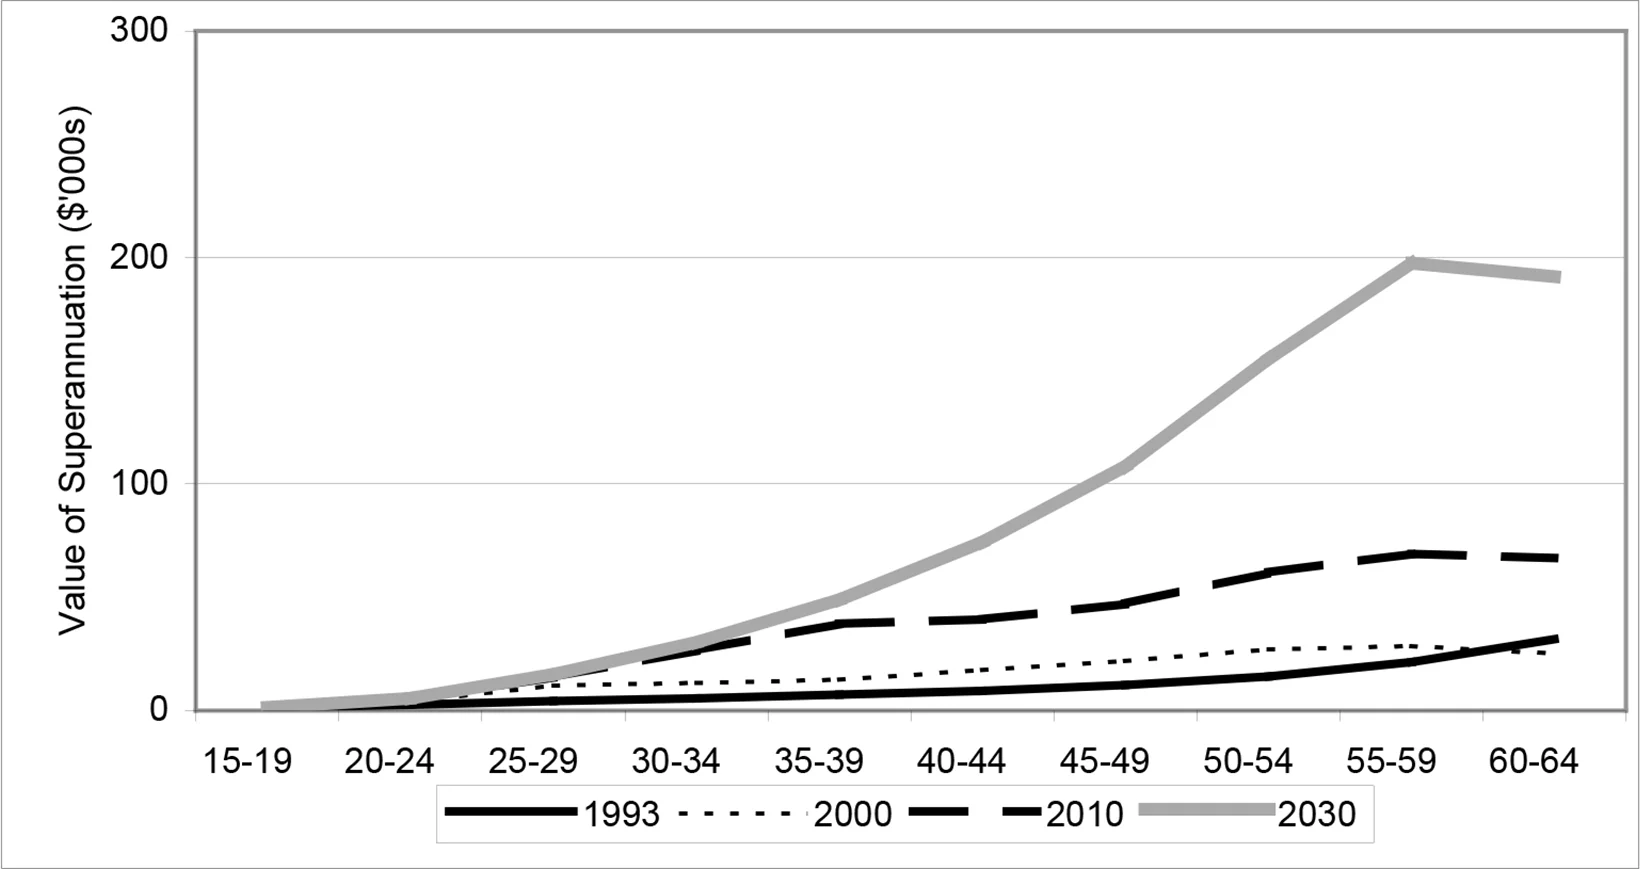
As Table 1 (Page 13) suggests, women’s accumulated superannuation upon retirement is expected to increase very rapidly over the next three decades. For example, the average account balances of women aged 55 to 59 are forecast to increase to $196,930 by 2030, up from only $23,993 in 1993. This is an increase of more than 700 per cent. Similarly, women aged 60 to 64 are forecast to have average account balances of just over $190,000 in 1993, up from about $30,000 in 1993 – a 449% increase.
Table 2 shows the superannuation balances for females aged 55-64 at three points across the superannuation spectrum – the 10th percentile, the median (or 50th percentile) and the 90th percentile. 80 percent of females with superannuation in this age range have a balance between the 10th and 90th percentiles.
| Percentile | 2000 ($) | 2010 ($) | 2020 ($) | 2030 ($) |
|---|---|---|---|---|
| 90% | 47,042 | 103,110 | 179,705 | 290,632 |
| Median | 29,459 | 61,674 | 109,600 | 183,638 |
| 10% | 3,850 | 27,226 | 55,032 | 93,414 |
Source: DYNAMOD.
A very encouraging feature of this table is the huge increase for the 10th percentile. In real terms it increases by almost $90,000 over the 30 years. Restating this, by 2030 DYNAMOD estimates that 90 percent of women aged 55-64 will have approximately $93,000 or more in superannuation.
3.6.1 Adequacy
Most people estimate that they will need around 60 percent of their annual pre-retirement income to be comfortable in retirement (ASFA, 2000). At the same time the government’s Age Pension provides a maximum income of 25 percent of the average total male earnings. If we make the not unreasonable assumption that the average total male earnings is the average pre-retirement income, those with only the age pension will have an income of 25 percent when they would like 60 percent to be comfortable. We assume people would like their superannuation to make up the other 35 percent required reach the comfortable level. It does not appear this will be the case for the majority of women. Consider women aged 55-64 in 2030 on the 10th percentile, if they invested their $93,000 superannuation at 5%, it will produce an annual income of $4,650 - approximately 11% of average earnings (in May 1999). The same calculation for those in this age group with the median $183,600 would add 23%. However, for those at the median, an asset of this size is certainly sufficient to begin affecting the age pension entitlements, via either the income or assets tests.
From these estimates it appears that at least half of all women will be relying, at least in part, on the Age Pension to support them for some time to come. By 2030 superannuation will be providing a substantial supplement to the Age Pension for these women but even with the income from superannuation they will be struggling to reach the accepted income level for a comfortable retirement.
4. Conclusion
In the future, will women be able to live comfortably in their retirement? Will they have plenty because they have contributed to and accumulated large amounts in superannuation up until their retirement? Or will they be no better off than those retiring at present?
NATSEM has developed a dynamic microsimulation model to project the lives and circumstances of individuals out until the middle of this century. This paper presents the first preliminary findings from this model using its new superannuation module. The addition of this module allows questions such as those above to begin to be answered. The superannuation modelling is unique in Australia in that it models behaviour at the individual level rather than on a group or overall level. This type of modelling allows greater detail than using other techniques.
The proportion of the population aged 65+ is projected to increase from 11% in 1991 to 24% in 2051 and the population aged 85+ will increase proportion five fold. Two-thirds of the 85+ population will be women. Statistics also show us that the proportion of women participating in the labour force is increasing; the proportion working part-time is increasing; and the median age for marriage has increased two years in the past ten.
These demographic and labour force changes impact on the earnings, and consequent superannuation accumulation, of women. Fortunately, changing employment status (full-time or part-time) — and the disruptions to labour force careers due to child bearing and rearing which are not often found in men’s careers — are easily accommodated within the dynamic model. Other factors that influence earnings and superannuation accumulation such as the increasing age of first marriage and childbirth, early retirement, and divorce are also accommodated.
The simulated results suggest that soon, if not already, the proportion of people who retire without at least some superannuation will be reduced to zero. This is a result of the government’s introduction of the SGC in 1992. Under the SGC, every employer must make superannuation contributions for employees earning more than $450 per month. The model suggests that very few people will not earn more than $450 in a month at least once during their working life.
While everyone will have some superannuation, the amounts are not likely to take the average women from near ‘poverty’ to ‘plenty’ in the near future. In 1999-dollar terms the average balance in superannuation is estimated to increase from $9,647 in 1993 to $89,591 in 2030. While the eight fold increase seems good, it really only highlights the poor current situation. For women getting close to withdrawing their superannuation (aged 55-59) the balances go from an estimated average of $24,000 in 1993 to $197,000 in 2030. A very encouraging aspect of the growth in superannuation assets is the growth in the bottom end. By 2030 NATSEM estimate 90 percent of women aged 55-64 with superannuation will have accumulated more than $93,000 in their accounts.
Another area of improvement is in the gender balance. NATSEM estimates that the average female superannuation balance will lift from 45% of the average male balance in 1993 to 70% by 2030
The estimates suggest that women’s accumulated superannuation upon retirement will increase very rapidly over the next three decades and the growth is across the superannuation spectrum. Consider 55-64 year old women in the middle of the superannuation range (on the median or 50th percentile), they will see their average superannuation balance rise from $29,459 to $183,638 over 30 years from 2000. While this is clearly a very dramatic rise, the rise for women at the bottom is perhaps more gratifying. For women of the same age but on the 10th percentile the increase is from $3,850 in 2000 to $93,414 in 2030. We estimate that 90 percent of women in this age group will have more than $93,000 in superannuation in 2030.
While these increases are dramatic and welcome, they will not move women to ‘plenty’. The Age Pension provides a retirement income of 25 percent of average male earnings, the amounts held in superannuation discussed above will supplement this pension with an additional 11-23 percent. Unfortunately as this supplementation rises, income and asset means test will start to reduce the Age Pension. Most people feel 60 percent of pre-retirement income is required to live comfortably in retirement. A total income of at most 36-48 percent of average weekly earnings for more than half of all women, achieved through superannuation and the Age Pension is still well below the comfortable or ‘plenty’ level .
The results found using this dynamic microsimulation model are preliminary. The dynamic nature of the model means that significant resources need to be put into validating every part of the model before the outcomes are truly reliable. While this validation is well underway, the process is not complete. However, the results to date are very promising and the level of detail unparalleled.
Footnotes
1.
ABS Projection Series II most closely reflects prevailing trends. The Series II assumptions are (i) a declining mortality rate; (ii) fertility rates falling to 1.75 by 2005/6 and then constant; and (iii) a net annual immigration gain of 70,000.
2.
‘The ABS uses the cohort-component method which begins with a base population for each sex by single years of age and advances it year by year by applying assumptions regarding future mortality and migration.’ (ABS 3222.0 pp.125)
Appendix A - Assumptions
In the ideal world, superannuation balances would be known for each of the 150,000 synthetic people at the beginning of the simulation. Unfortunately, there is limited data available on superannuation holdings in Australia and superannuation holdings for every person in 1986 are certainly not available. Superannuation funds, in general, are private organisations and hence details on individual holdings are not generally available. The Australian Bureau of Statistics has periodically collected data on superannuation, but the majority of their data relates to coverage and annual contributions rather than actual holdings. The reason for ABS not collecting data on actual holdings is clearly based on the unreliability of such data. Until the late 1990s, most people did not know the value of their accumulated funds and they often had more than one account.
A major exception to this general lack of detailed data on superannuation holdings is the data collected from major private superannuation funds by the Retirement Income Modelling (RIM) Unit of Treasury in 1993. RIM collected information on the distribution of superannuation assets and contributions from three major life companies. The study covered about 15% of total superannuation assets and around 1.8 million people (Brown, 1994). This data collection and the resulting research and analysis by RIM provide a valuable source of data for DYNAMOD-3.
Defined Benefits and Accumulated Funds
Historically there have been three types of superannuation funds. The first is the “defined-benefit” scheme where the pension entitlement is a complex calculation involving the number of years in the scheme and the salary at the time of retirement. This type of fund is predominately found in the public sector and in large white collar industries. In general these funds are heavily subsidised by the employer and very generous in their benefits. However, most defined-benefit schemes are now closed to new entrants.
The second type of scheme is the ‘accumulation’ scheme (or defined-contribution scheme). With the accumulation scheme, contributions (by the individual and/or their employer) and interest build up in a personal account over time. The balance of this account at the time of retirement represents the entitlement. This is the most common type of scheme in the private sector. The introduction of the three percent industrial award superannuation, and then the Superannuation Guarantee Charge (SGC) in 1992, have resulted in accumulation funds becoming the dominant form of scheme. In June 2000, 87% of superannuation members were in an accumulation scheme (see Table A1).
| Fund Type | Members (000’s) | Members (%) | Assets ($ billion) | Assets (%) |
|---|---|---|---|---|
| Accumulation | 18,885 | 87% | 257 | 60% |
| Defined Benefit | 499 | 2% | 24 | 6% |
| Hybrid | 2,344 | 11% | 146 | 34% |
| TOTAL | 21,726 | 100% | 427 | 100% |
Source: APRA Superannuation Trends – June Qtr 2000.
A third type of fund is a ‘hybrid’ scheme, representing a combination of the defined-benefit and accumulated funds.
Given the predominance of the accumulation scheme, in DYNAMOD all superannuation entitlements are treated as if they were of the accumulated type. RIM noted that members of defined-benefit schemes in 1993 had an older age distribution and had a heavier concentration of higher salary members than members of accumulated schemes. This resulted in the average entitlement in defined-benefits accounts being 3.8 times higher than in accumulation schemes. The omission of defined-benefit funds may therefore underreport aggregate superannuation in the early years of the simulation.
Employer Contributions
Under industrial award superannuation and then under the SGC, employers have been required to make minimum contributions for most employees to a complying superannuation fund. The minimum contributions under SGC are shown in Table A2.
| From | Percent of Salary |
|---|---|
| July 1996 | 6% |
| July 1998 | 7% |
| July 2000 | 8% |
| July 2002 | 9% |
Superannuation contributions do not have to be made for some categories of employees. These categories include employees who are:
paid less than $450 in a month;
aged 70 or over;
under 18 years of age and working for not more than 30 hours a week;
performing work of a domestic or private nature for not more than 30 hours a week for a non-business employer; and
who have vested benefits in excess of their pension RBL and who elect not to receive any more employer contributions.
Based on the exclusions above, the simulation assumes that everyone receives an employer contribution equal to the rate defined in Table 2. The only exceptions are those with gross annual earnings less than $5400 (450 x 12); those under 18 years and not working full-time; and those over the superannuation age limit (currently set at 70). Again there may be some underreporting in the early years as some organisations pay more than the SGC amount. This is particularly true in the public sector.
Employee and Voluntary Contributions
In addition to the employer contributions to an individual’s superannuation, a person may either be required to contribute part of their salary into a superannuation fund or may voluntarily contribute to their own superannuation fund. In DYNAMOD, employee contributions are added to the same account as the employer funds. Whether a personal contribution is made and, if so, the amount contributed, is based on two sources - a RIM conference paper (Tinnion, 1998) for non-employees and those aged under 45; and the 1995 ABS publication ‘Superannuation Australia’ for employees aged 45+.
For people who are currently unemployed, not in the labour force or doing unpaid work, it is assumed they make no contribution to their superannuation. If a person is employed then the chance of them contributing is based on a probability distribution. The distribution is shown in Table A3 below. The amount contributed is five percent of their salary. This rate is one of the most common default rates used by organisations that require employees to contribute to a superannuation scheme.
| Age | Male | Female |
|---|---|---|
| Under 18 | 2.4% | 4.8% |
| 18 – 24 | 16.1% | 19.3% |
| 25 – 34 | 27.5% | 39.8% |
| 35 – 44 | 32.4% | 46.9% |
| 45 – 54 | 32.5% | 46.4% |
| 55 – 59 | 24.8% | 35.6% |
| 60 – 64 | 10.4% | 20.7% |
| 65+ | 0.6% | 1.4% |
Source: Calculated from RIM Conference Paper 98/1.
For employees aged 45 –76, a more complex algorithm is used based on ABS data. ABS Cat 6319.0 Superannuation Australia November 1995 “Table 13" shows employees aged 45-76 making various personal contributions (see Table A4 below). On the basis of this table, an annual employee contribution rate is imputed for all employees aged 45-76.
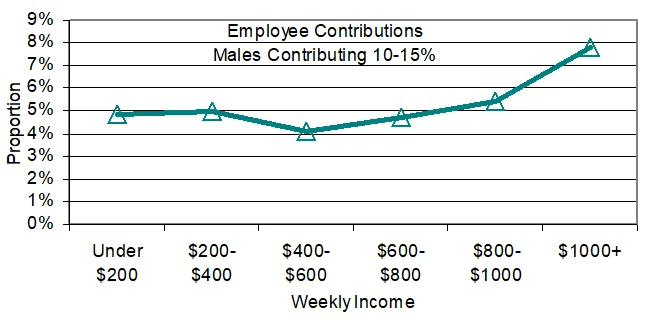
The reason for using this income-based employee data is to attempt to capture changing rates of contribution. There is evidence that the favourable taxation rates on superannuation contributions may induce some individuals to contribute large amounts to their superannuation fund. This is particularly true for high income individuals. Evidence of this can be seen in Figure A1. The figure shows a correlation between weekly income and the chance of giving 10-15% of income (a high rate).
The use of the ABS data shown in Table A4 attempts to model the relationship between increasing contributions and increasing income.
| Average Weekly Earnings | Employee Contribution | ||||||||
|---|---|---|---|---|---|---|---|---|---|
| Zero | < 3% | 3-4% | 4-5% | 5-6% | 6-10% | 10-15% | 15+% | Total | |
| MALES (000’s) 45-76 years | |||||||||
| Under $200 | 16.3 | 0.3 | 0.4 | 0.0 | 0.6 | 0.6 | 1.1 | 3.6 | 23.9 |
| 200-400 | 47.8 | 4.2 | 3.7 | 1.6 | 2.0 | 4.5 | 3.6 | 5.2 | 75.9 |
| 400-600 | 124.4 | 20.9 | 18.4 | 24.3 | 30.2 | 35.2 | 11.2 | 7.8 | 284.8 |
| 600-800 | 78.5 | 16.1 | 16.1 | 21.3 | 29.2 | 36.7 | 10.0 | 4.9 | 224.4 |
| 800-1000 | 35.5 | 12.0 | 9.3 | 19.0 | 24.7 | 28.7 | 7.5 | 1.7 | 147.7 |
| 1000+ | 49.3 | 14.8 | 9.4 | 22.1 | 29.5 | 33.3 | 14.3 | 10.4 | 195.0 |
| Not reported | 17.0 | 0.3 | 0.3 | 0.4 | 1.9 | 1.3 | 1.3 | 0.0 | 37.4 |
| Total | 368.8 | 68.6 | 57.6 | 88.7 | 118.1 | 140.3 | 49.0 | 33.6 | 989.1 |
| FEMALES (000’s) 45-76 years | |||||||||
| Average Weekly Earnings | Zero | < 3% | 3-4% | 4-5% | 5-6% | 6-10% | 10-15% | 15+% | Total |
| Under $200 | 56.7 | 0.9 | 0.4 | 0.9 | 1.8 | 2.4 | 3.6 | 5.8 | 73.5 |
| 200-400 | 133.9 | 11.0 | 8.4 | 6.5 | 10.1 | 14.5 | 7.2 | 6.3 | 203.9 |
| 400-600 | 114.7 | 15.5 | 11.1 | 16.9 | 22.4 | 32.5 | 9.2 | 4.6 | 237.8 |
| 600-800 | 40.6 | 7.0 | 8.0 | 11.7 | 13.6 | 18.7 | 5.3 | 2.1 | 114.7 |
| 800-1000 | 8.7 | 4.2 | 2.1 | 6.7 | 6.0 | 14.0 | 2.4 | 0.8 | 48.4 |
| 1000+ | 6.0 | 2.0 | 0.0 | 1.9 | 3.9 | 2.5 | 1.7 | 1.5 | 21.9 |
| Not reported | 7.9 | 0.0 | 0.3 | 0.2 | 0.2 | 1.2 | 0.1 | 0.2 | 17.0 |
| Total | 368.5 | 40.6 | 30.3 | 44.8 | 58.0 | 85.8 | 29.5 | 21.3 | 717.2 |
Source: ABS Cat 6319.0 Superannuation Australia November 1995 Table 13.
Number of Accounts
The existence of multiple accounts for individuals is well known and is discussed in Rothman (1995). The reasons for the multiple accounts include:
People holding more than one job;
Requirements that some award payments be paid into a different account;
Timing difficulties, that is, old accounts being reported as current when in reality they are inactive (for example the person may have changed jobs and started in a new scheme/account and data relating to the old account is still being reported); and
Other unusual arrangements, such as where superannuation associated with performance pay for public servants was put in a separate account
DYNAMOD calculations are based on individual data rather than account data and DYNAMOD assumes there are no differences between superannuation funds. These assumptions mean that the there is no difference between a person having three accounts with $1,000 in each and a person having $3,000 in one account. The existence of multiple accounts does not impact on the model.
Early Withdrawals
In general, funds contributed to superannuation schemes cannot be withdrawn until retirement (and being aged over 54). However, the superannuation legislation did allow access to funds in certain circumstances — namely times of severe financial hardship or emigration from Australia. There was some abuse of these guidelines, with the result that the legislation for gaining early access was tightened and the preservation age increased to 60 years for those born after June 1964. From 1 July 1999, all earnings and contributions can only be paid out if a person dies, becomes disabled, or APRA approves an early release. Permanent emigrates have to wait for their funds until retirement. These changes have had such an impact as to make early withdrawals a minor, short term case which can be ignored. Early withdrawals are not modelled in DYNAMOD.
Rate of Return on Invested Funds
An average rate of return for superannuation funds is very difficult to obtain. Firstly, there are some 213,747 superannuation funds in Australia (APRA June 2000). Of these, 211,175 have less than five members. This number of small funds makes calculation of an overall rate of return for superannuation funds difficult and perhaps meaningless, as it is possible that a number of these small funds are not motivated by maximising returns over the long term. Exclusion of these small funds reduces the total assets by only 15% (down $68B to $409B) and should allow the rate of return of the remaining major funds to be calculated. However, a second problem with measuring rates of returns then becomes evident - rates of return can still not be accurately obtained as the superannuation industry’s ‘reserving’ practice. Reserving involves paying a smaller rate of return in good years and putting the extra funds aside for use when the actual rate of return is negative or low. A number of superannuation funds use reserving to implement a policy of not passing on negative returns. In years when the actual return is negative or zero, the reserve is used to pay a small positive return. The practice of using reserves results in a smoothing of rates and makes measurement of actual real returns very difficult to obtain.
An InTech survey (2000) shows an asset weighted average for a range of major retail growth funds of 6.3% in real terms over the last seven years, and 8.4% over the last five. The RBA in Occasional Paper No 8, “Historical Economic Statistics”, show average ten year growth for a balanced fund of 13.0% to 1995, but inflation was an average 5.4% pa over the period giving a real rate of 7.6%. ARPA and Treasury use 8% nominal as an upper bound.
ARPA suggest that forward projections above 5% or 6% real are likely to be unsustainable.
The consensus view on these figures would suggest a real rate of 6% for 1986-94, 8% for 1995-99 and 5% for 2000 onwards. These are rates used in DYNAMOD.
References
- Antcliff, S (1993). An Introduction to DYNAMOD. DYNAMOD Technical Paper No. 1, NATSEM University of Canberra.
- (2000). Super Facts Fact Sheet #2.
- Brown, C. (1994). The Distribution of Private Sector Superannuation Assets by Gender, Age and Salary of Members. .
- Clare, R (1994). Women and Superannuation’, in Office of EPAC.
- Goward, P (1997). Golden Eggs or Empty Nests – Reflections on Making Retirement Better for Women. .
- King, A, Bækgaard, H, Robinson, M (1999). NATSEM, University of Canberra, December. Technical Paper No. 19, NATSEM, University of Canberra, December.
- Knox, D (1994). The Relationship Between the Age Pension and Superannuation Benefits, Particularly for Women’, in Office of EPAC.
- (1996). Ageing in OECD Countries: A Critical Policy Challenge.
- Rothman, George P (1996). Aggregate and Distributional Analysis of Australian Superannuation using the RIMGROUP Model. .
- Rothman, George P (1997). Aggregate Analyses of Policies for Accessing Superannuation Accumulations. .
Article and author information
Author details
Funding
No specific funding for this article is reported.
Publication history
Copyright
© 2023, Kelly et al.
This article is distributed under the terms of the Creative Commons Attribution License, which permits unrestricted use and redistribution provided that the original author and source are credited.