
Jump to
1. Introduction
The sub-field of dynamic microsimulation modelling, the inter-temporal simulation of micro units over time, was one of the original areas of microsimulation (Orcutt, 1957) together with spatial microsimulation (Hägerstrand, 1957). It has evolved, initially relatively slowly, from the preserve of large-scale projects with super-computers to the realm of PhD students and being a day to day tool for policy analysts.
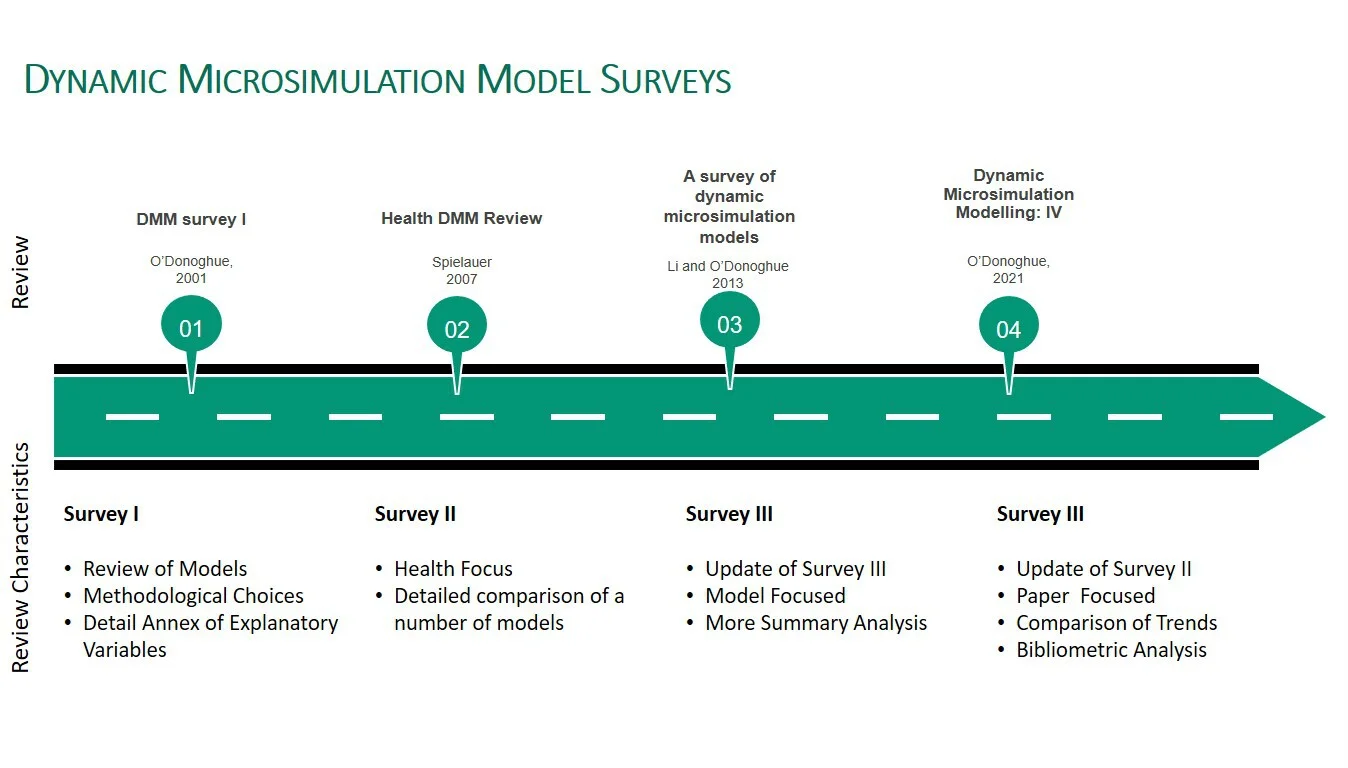
While there have been many reviews of microsimulation in general (Merz, 1991; Bourguignon and Spadaro, 2006), there have been a series focusing on the sub-field of dynamic microsimulation. Reviews of dynamic microsimulation modelling have been undertaken at approximately 7 year intervals over time (O’Donoghue, 2001; Spielauer, 2007; Li and O’Donoghue, 2013 and see Figure 1).1 These reviews have focused on describing uses and applications of models and to categorise methodological choices made by modellers. Historically, methodological choices of interest were
choice of the sample being based on cross-section or a synthetic cohort,
whether the model was open or closed,
whether models were aligned to external data sources,
whether there were endogenous behaviours in the model,
type of base data,
whether discrete time or continuous time was used or
whether they were linked with macro models.
In a review of papers (Figure 1) at an early stage of the field and given the size of the field, O’Donoghue (2001) was able to review almost every paper in the field, with a particular focus on methodological choices, including detailed sub-module characteristics. Spielauer (2007) paper had a slightly different format, taking a greater focus on the use of dynamic microsimulation models used in a health setting and undertook a detailed comparison of a number of models. Li and O’Donoghue (2013) and the related paper Li et al. (2014) in the Handbook of Microsimulation, given the later expansion of the field, focused on summary statistics of the structure of the field and methodological choices made by papers in the field.
The sub-field remains a relatively important part of the microsimulation community with 22% of papers at the 2019 World Congress of the International Microsimulation Association held at the National University of Ireland, Galway. Progress in the field is accelerating. As nearly half the papers published in the field of dynamic microsimulation have been published since the last survey article, it is timely to provide a more recent survey and critical assessment of the direction of the sub-field (Table 1). The number of publications per 5 year period rose rapidly to 2012, with the rate of growth slowly at this point at a historically high level. Globally microsimulation is used in many more disparate areas, reflecting a decline in papers published in this sub-field accounting from 7.5% a decade ago to 3.5% of all papers that reference microsimulation in the past 5 years.
| Period | Citations |
|---|---|
| 2022-2023 | 380 |
| 2017-2021 | 900 |
| 2013-2016 | 718 |
| 2008-2012 | 761 |
| 2003-2007 | 514 |
| 1998-2002 | 319 |
| 1993-1997 | 146 |
| 1988-1992 | 30 |
| 1983-1987 | 8 |
| 1978-1982 | 4 |
| 1973-1977 | 1 |
Given the scale of publication since 2013, there is a merit in reviewing the literature again. It is particularly interesting to assess changes in use and methodological choices made since the last survey nearly a decade ago. We continue the structure of previous surveys, reviewing the evolution of dominant methodological choices, but make use of bibliometric tools to assist in the analysis of the larger field.
Section 2 describe the theoretical framework used to underpin the bibliometric analysis. Section 3 describes briefly the methodological choice taken in reviewing the bibliometric data. In section 4, we analyse the data, with conclusions and future research directions reported in section 5.
2. Theoretical framework
Dynamic microsimulation models primarily help us to understand policy, economic and social change using simulation at the micro level via the complexity dimensions of population, policy, behaviour and time (O’Donoghue, 2014).
A number of publications have tried to present dynamic microsimulation models in mathematical form such as Klevmarken (1997) and O’Donoghue (2021). The broadest household level dynamic microsimulation model simulates the presence and levels over time for different incomes sources , and for different factors such as health, wellbeing, consumption, care requirements, environmental impact for individuals nested within families within the household . As an intertemporal simulation model the explanatory factors also need to be simulated:
Where is an individual fixed or random effect, is a time varying component for the model and the time varying component for the model.
However as the field moves beyond income related outcomes to other outcomes such as consumption, environmental, time (for caring) and in particular health outcomes, the ultimate dependent variable is often not an income variable, but rather a different outcome :
However, in most cases the structure is simpler than this as complexity comes with a cost and so very few models utilise a household units of analysis due to difficulties in maintaining the coherence of intra unit correlations, while long-run dynamics are very challenging within shorter panels. More typically, the most income focused models aggregated unit of analysis is the family:
However, although occasional utilised in the past, the individual as the unit of analysis is growing:
Particularly for models with a health related focus:
In addition, the use of dynamic microsimulation type models for nowcasting, where the time trend of the distribution is more important that the longitudinal trajectory of individuals have become important in understanding the impacts of economic and health crises in near to real time (Navicke et al., 2014; O’Donoghue et al., 2020):
Figure 2 defines the main components of a traditional maximal dynamic microsimulation model, however not necessarily all components are in every model. This to some extent was the focus of many large-scale modelling projects such sfb3 model (Orcutt et al., 1986), the CORSIM and DYNCAN models (Caldwell and Morrison, 2000), APPSIM (Cassells et al., 2006), LIAM2 (De Menten et al., 2014). However as we will find later in the results section, the field is moving radically away from this perspective, even if it remains the dominant focus of dynamic microsimulation model papers in the IMA World Congresses.
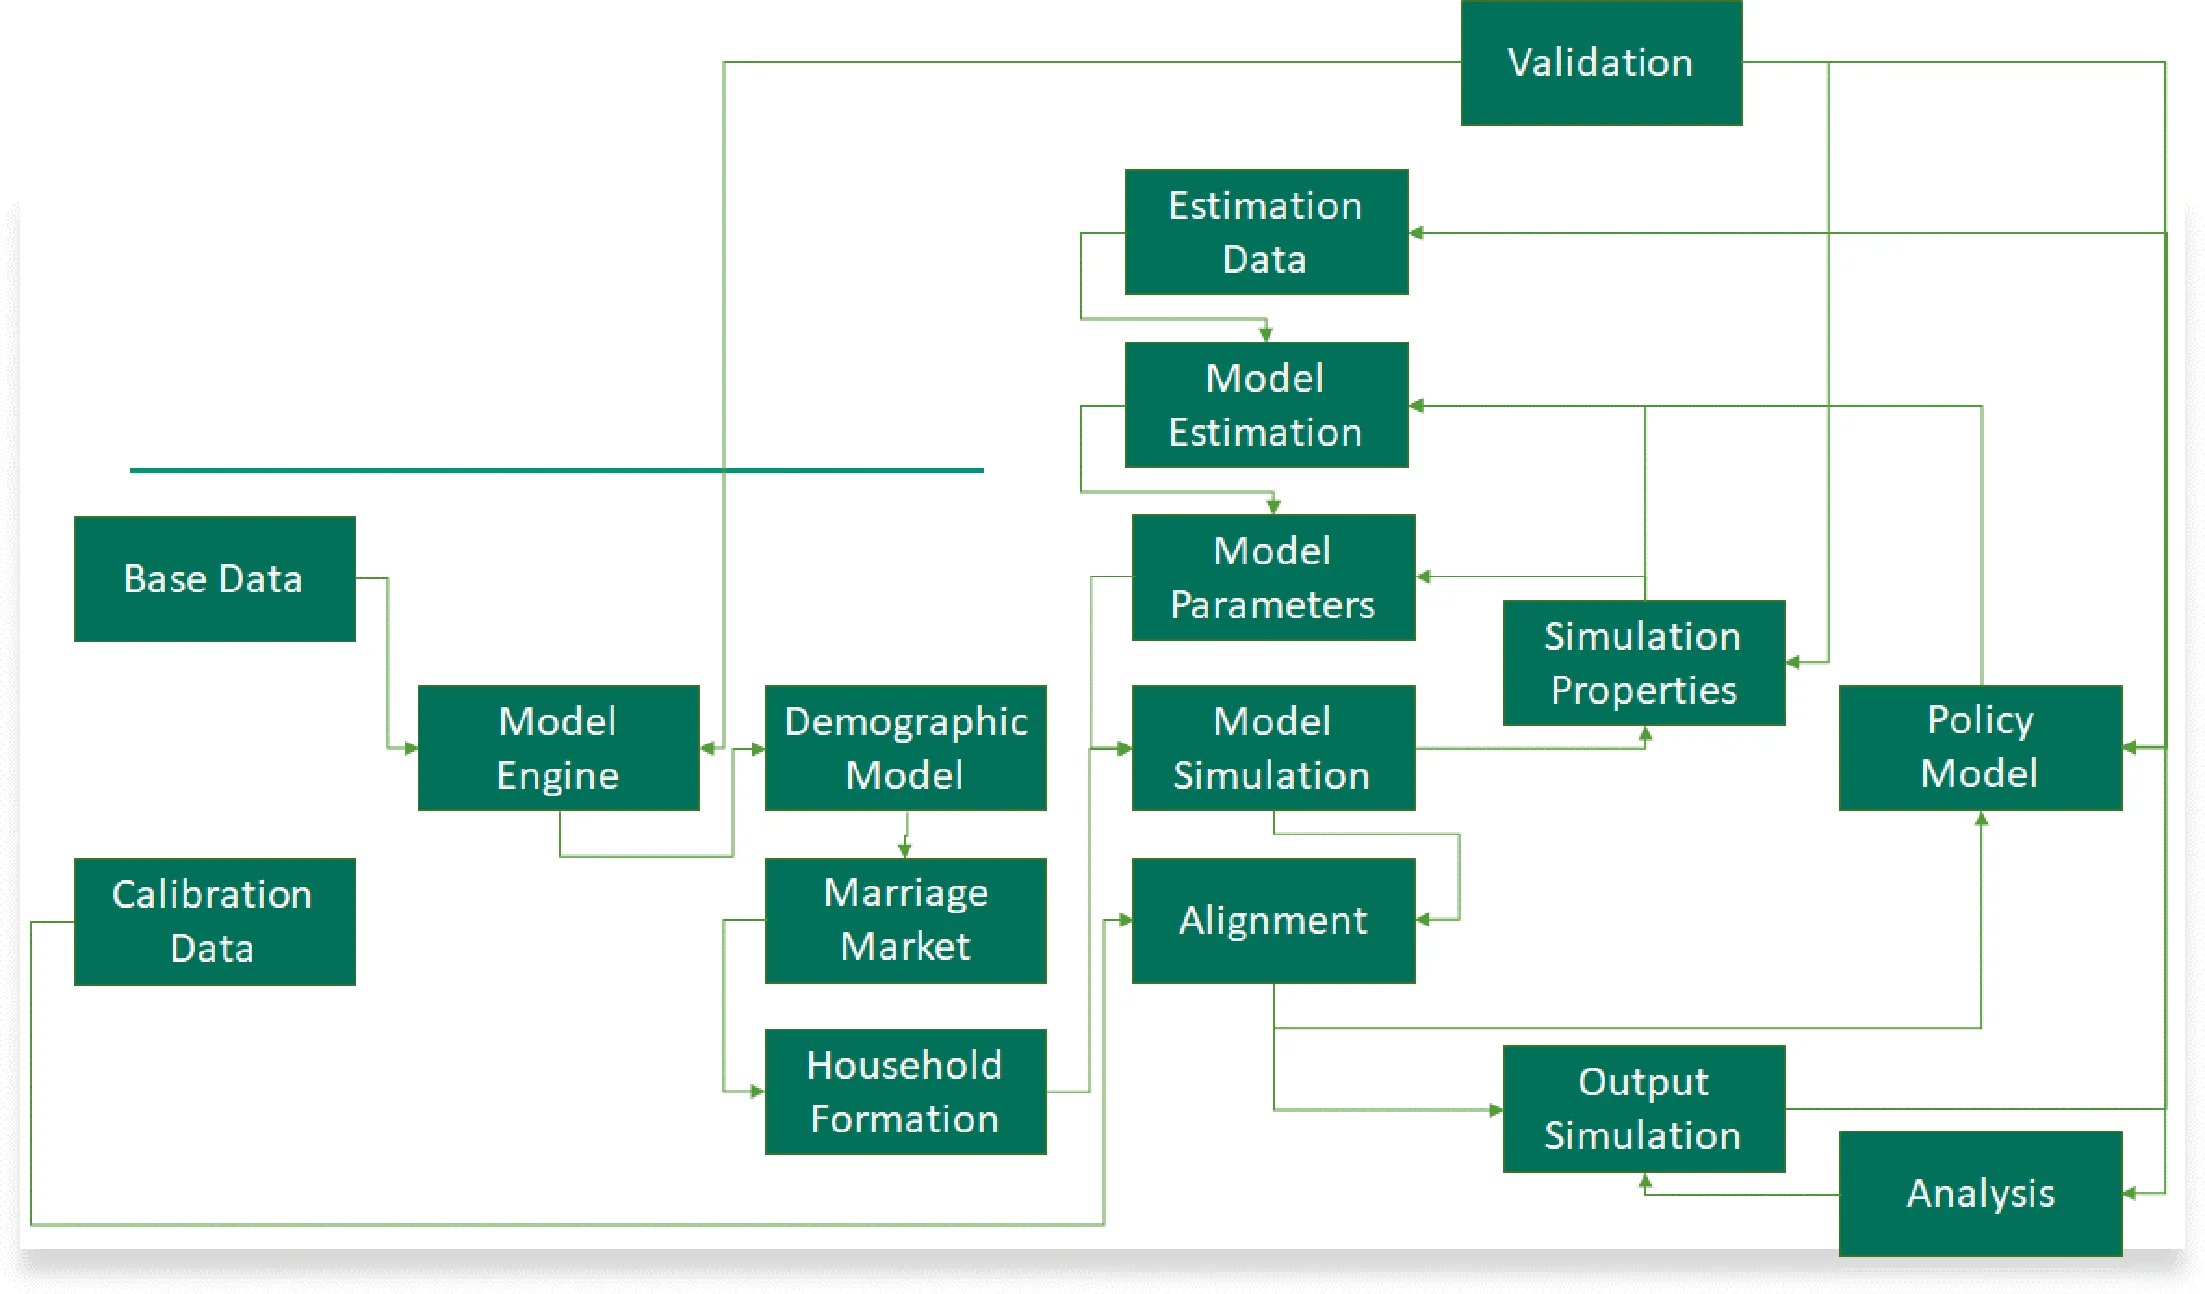
As a micro model, it starts with a base dataset of micro units such as families or individuals. These are taken from either actual data such as a census, survey or administrative data in the case of a population mode
l or as hypothetical data in the case of a cohort model. There is a simulation modelling framework that manages the data handling and processing, either using a specific software system such as LIAM2 (De Menten et al., 2014), JASMINE (Mannion et al., 2012), neworder (Smith, 2021) or MODGEN (Spielauer, 2009), a bespoke programmed engine in for example C++ or using statistical software or other off the shelf tools. (O’Donoghue, 2021) provides a textbook on how to develop a dynamic microsimulation model in a statistical package.
Simulation modules are broadly broken up into demographic modules (which typically occur before the other modules relevant for the application, and policy modules. Demographic modules utilise tools such as life-tables for mortality, marriage markets for partner selection and statistical methods such as transition matrices or logistic regressions for transitions such as emigration, leaving the family home or fertility and family formation decisions (Bouffard et al., 2001; Rephann and Holm, 2004; O’Donoghue et al., 2010; Lomax and Smith, 2017). Modelling immigration involves another bespoke process. The extent of the household formation processes (Richiardi and Poggi, 2014) depend upon the unit of analysis, which are often the individual or the family. It is rare to have the household as the unit of analysis, which involve household membership decisions by other adults.
Given the diversity of the model application, the Module Simulation component is broadening. Traditionally these dimension, would mainly have consisted of labour market modules, however increasingly, they include processes like education (Smith, 2021), long temr care (Atella et al., 2017) land use (Ryan and O’Donoghue, 2019) and particularly health care processes (de Oliveira et al., 2023). Many models use alignment or calibration. Typically unaligned characteristics are simulated using micro-equations, with results adjusted or aligned to external calibration totals.
There is greater homogeneity in regression models involving the estimation of of the relevant status (e.g. labour market or health etc) and potentially income variables using estimation data and then simulating them on the dynamic microsimulation dataset (Nelissen, 1993). In most dynamic microsimulation models, the equations are reduced form statistical models instead of structural behavioural models (Klevmarken, 1997). However occasionally decisions such as labour supply or retirement are endogenous to policy (Garibay, 2023).
Lastly dynamic microsimulation models involving the simulation over time of households can generate prodigious amounts of data, meaning that dynamic microsimulation models often have bespoke analytical tools to analyse model results and to calculate specific life-cycle statistics. Given the potential complexity, validation tools are important to minimise error (Caldwell and Morrison, 2000) at all levels of the model from the model engine to simulation properties of modules to policy analytical tools to output totals.
2.1. Complexity
The balance between model comprehensiveness and parsimony is a constant tension. In life-cycle simulations, much of the explanatory variables themselves change, requiring these variables also to be simulated. Attempts to improve the captured heterogeneity of models can lead to an increase in explanatory variables, further increasing complexity. A desire to model units of analysis beyond the individual such as the family further increase complexity.
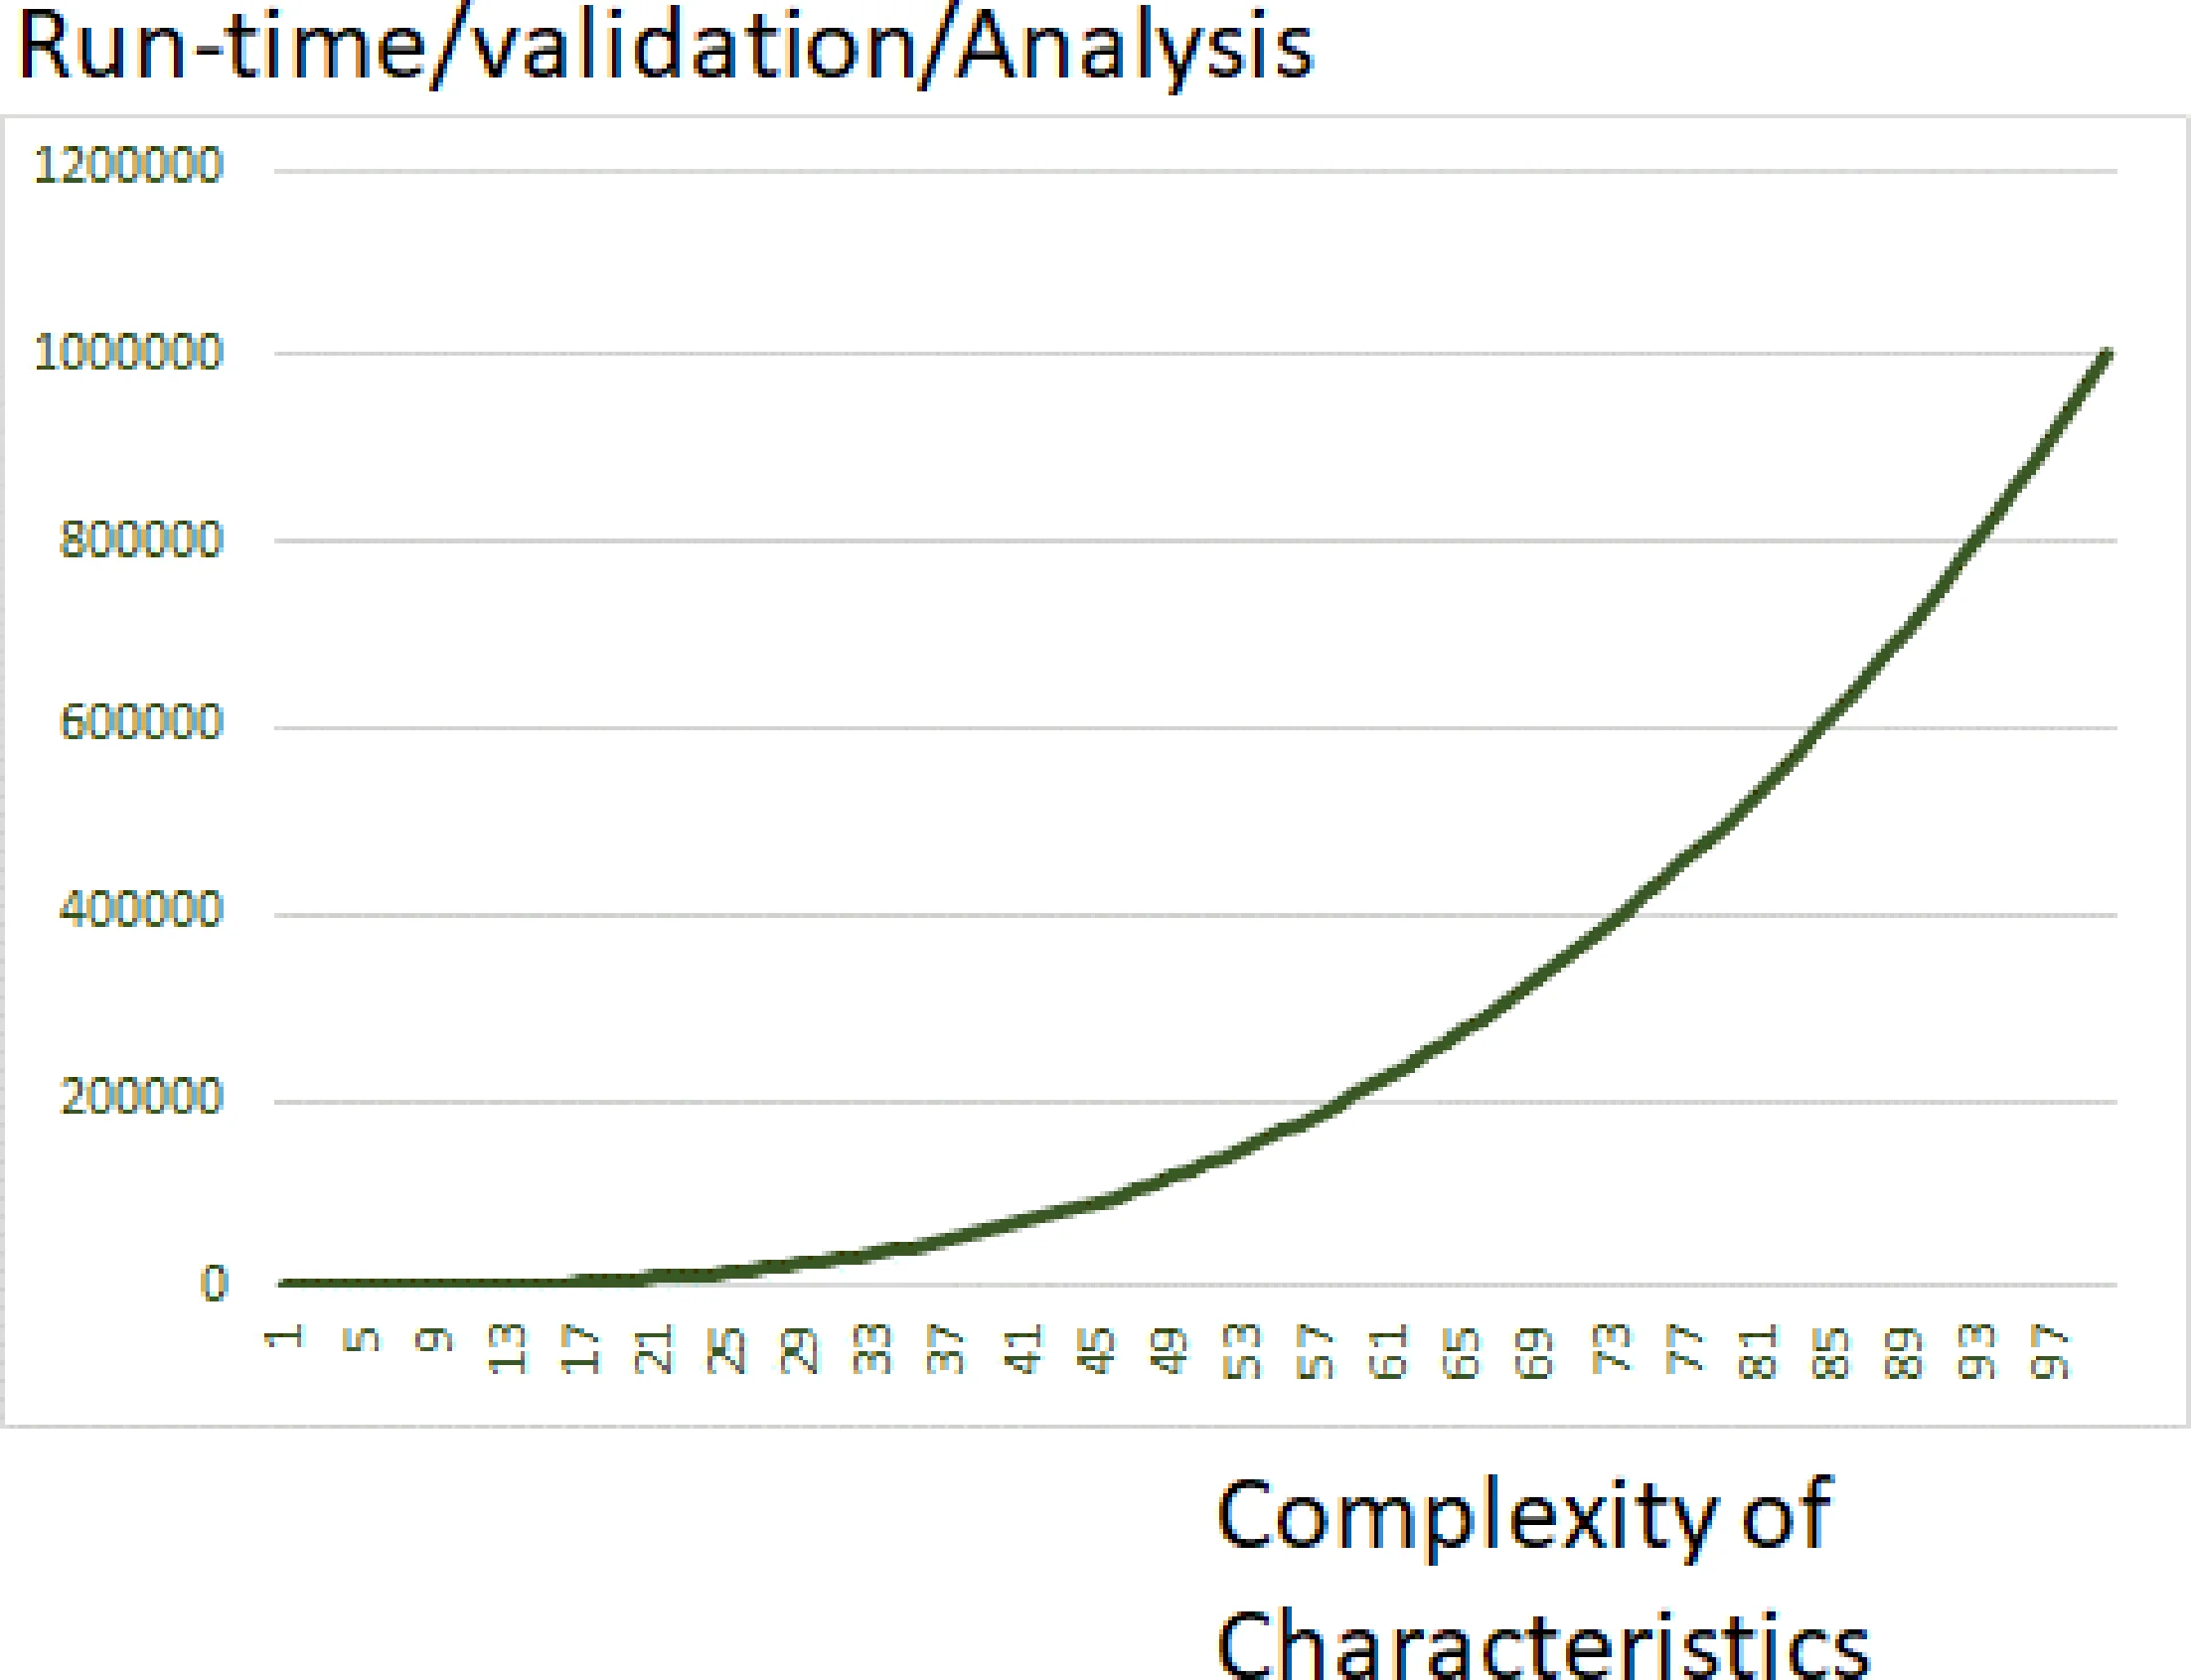
Complexity comes with a cost, however. While each of these choices are justifiable in their own right in improving the explanatory power of a model, cumulatively additional complexity increases in a non-linear way, the challenges in running a microsimulation model (Figure 3). As the complexity of a model increases, the cost in terms of development run-time, validation, analysis time and consequential sources of error increase at a faster non-linear rate. More complex models are thus more costly, time consuming, harder to interpret. This is certainly my experience in microsimulation model development. It would be useful to quantitatively assess these trade-offs. Although minimising complexity is common sense, it is not always common practice. The choice of minimising complexity does not necessarily mean that we avoid complex problems. Rather the solution may be in developing multiple tools, each of which is less complex and thus much easier to validate, rather than developing a large-scale multi-purpose model.
Thinking about complexity and microsimulation models reminds us of what models are; road maps of reality, to enhance our understanding of reality not to replicate reality. An economic model is thus a simplified description of reality. To paraphrase George Box, the aim is not to be right but to be useful. A model should therefore be as it as complex as it needs to be.
A parsimonious model can be defined as simple models with great explanatory predictive power. They explain data with a minimum number of parameters, or predictor variables as possible.2 On the other hand, the goodness of fit of a statistical model describes how well it fits a set of observations. Parsimony is based upon Occam’s razor, or “the law of briefness” in that you should use no more “things” (or parameters) as necessary; with parsimonious models having just the right number of predictors needed to explain the model well. Parsimony can be compared to goodness of fit in that the former attempts to simulate new data well, while the latter attempts to describe the estimation data well. These can be conflicting goals with parsimonious models have a lower goodness of fit, while a higher goodness of fit model may contain more explanatory variables with poorer simulation properties. The focus on model efficiency such as the Akaike’s Information Criterion (AIC) or the Bayesian Information Criterion (BIC) are tools used by statisticians to examine model efficiency. Parsimony is a much-ignored virtue, especially by reviewers! The peer review process often magnifies this process with helpful reviewers encouraging additional complexity or tweaks to enhance a model. I can count on one hand how many times reviewers have asked the opposite, to reduce the complexity of the model and increase parsimony.
2.2. Main modelling choices
The modelling choices in relation to open/closed, alignment and modelling time-period, within dynamic microsimulation models are well discussed in the literature (Harding, 2007; Harding and Slottje, 1995). Here we discuss some of the implications. We do not discuss one of the other main choices relating to cohort versus population models as although having different analytical dimensions they have limited implications in terms of other modelling choices (Harding, 1993).
The choice to align or not to align is a debate has existed since the start of the field and is a fundamental choice (Li and O’Donoghue, 2014). Alignment often calibrates equations to external control totals because it has been challenging to use historical data to project coherent future scenarios. There is an argument that calibration or alignment is wrong, that needing to align a model means that the under-lying system of equations are “wrong” and that this can be resolved by improving the simulation performance of these equations. The question however, is it worth even trying to find this “Holy Grail”? Particularly for complex models, can we ever hope to predict the future well? Given the impossibility of forecasting at the resolution contained in a dynamic microsimulation model, is it more effective to consider a useful but simpler objective, such as scenario analysis or foresight analysis?
The choice of discrete or continuous time as the period of analysis is another choice (Galler, 1997). Continuous time is relatively more challenging in an alignment situation, albeit giving better a temporal resolution and better able to capture temporal inter-dependencies than discrete time.
It is more challenging to model for a number of reasons
It is possible to align hazard model but loses much of the continuous nature as much of the calibration data is discrete
Behavioural models such as labour supply have moved to discrete choice state space, reflecting the lumpy non-continuous nature of choices and corresponding more realistically with reality.
However, there are some specific needs for continuous models such as in demographic event timings or intra year labour market characteristics such as short unemployment spells. In addition, when models are not aligned in discrete time, they may not be more intrinsically more complex. To some extent, however this modelling choice is an ad hoc decision depending upon the specific modelling need and the availability of appropriate data.
The choice between whether a model is open or closed is the less complex (Mannion et al., 2012). A closed model means essentially partners, in mate selection, are found within a model, while in an open model partners are imported when required. Most models are open for births and migration however. Open models have the advantage of being more easily adopted for parallel processing, as there fewer interactions between units. It is more difficult to align open models.
Thus, there are computational merits in being open. However, there needs to be a parallel set of processes for characteristics of spouse at the point of importing in keeping for example, the employment rate of imported spouse equivalent to similar people in the simulation. It can be challenging to ensure consistency with the rest of the simulation. Simplification may however, not lose much.
2.3. Two broad philosophies
From a structural point of view, traditional microsimulation modelling choices broadly clustered around two distinct modelling philosophies.
Closed-Aligned-Discrete
Open-Not Aligned-Continuous
The first cluster incorporates models and model frameworks such as DYNASIM, MIDAS/LIAM2, DYNACAN and APPSIM. They are closed with a marriage market within the model, but open for new births and immigrants. They use alignment with external control totals and run in discrete time, with transitions typically of a year. The second cluster contain models and model franework such as Lifepaths, MODGEN etc. developed by Wolfson, and Spielauer amongst others. They are open with partners “imported” into the sample, are non-aligned in continuous time with systems of equations explaining transitions. In this paper, we will consider whether the rapidly growing literature has maintained this clustering or whether new clusters have evolved.
2.4. Efficiency gains in microsimulation models
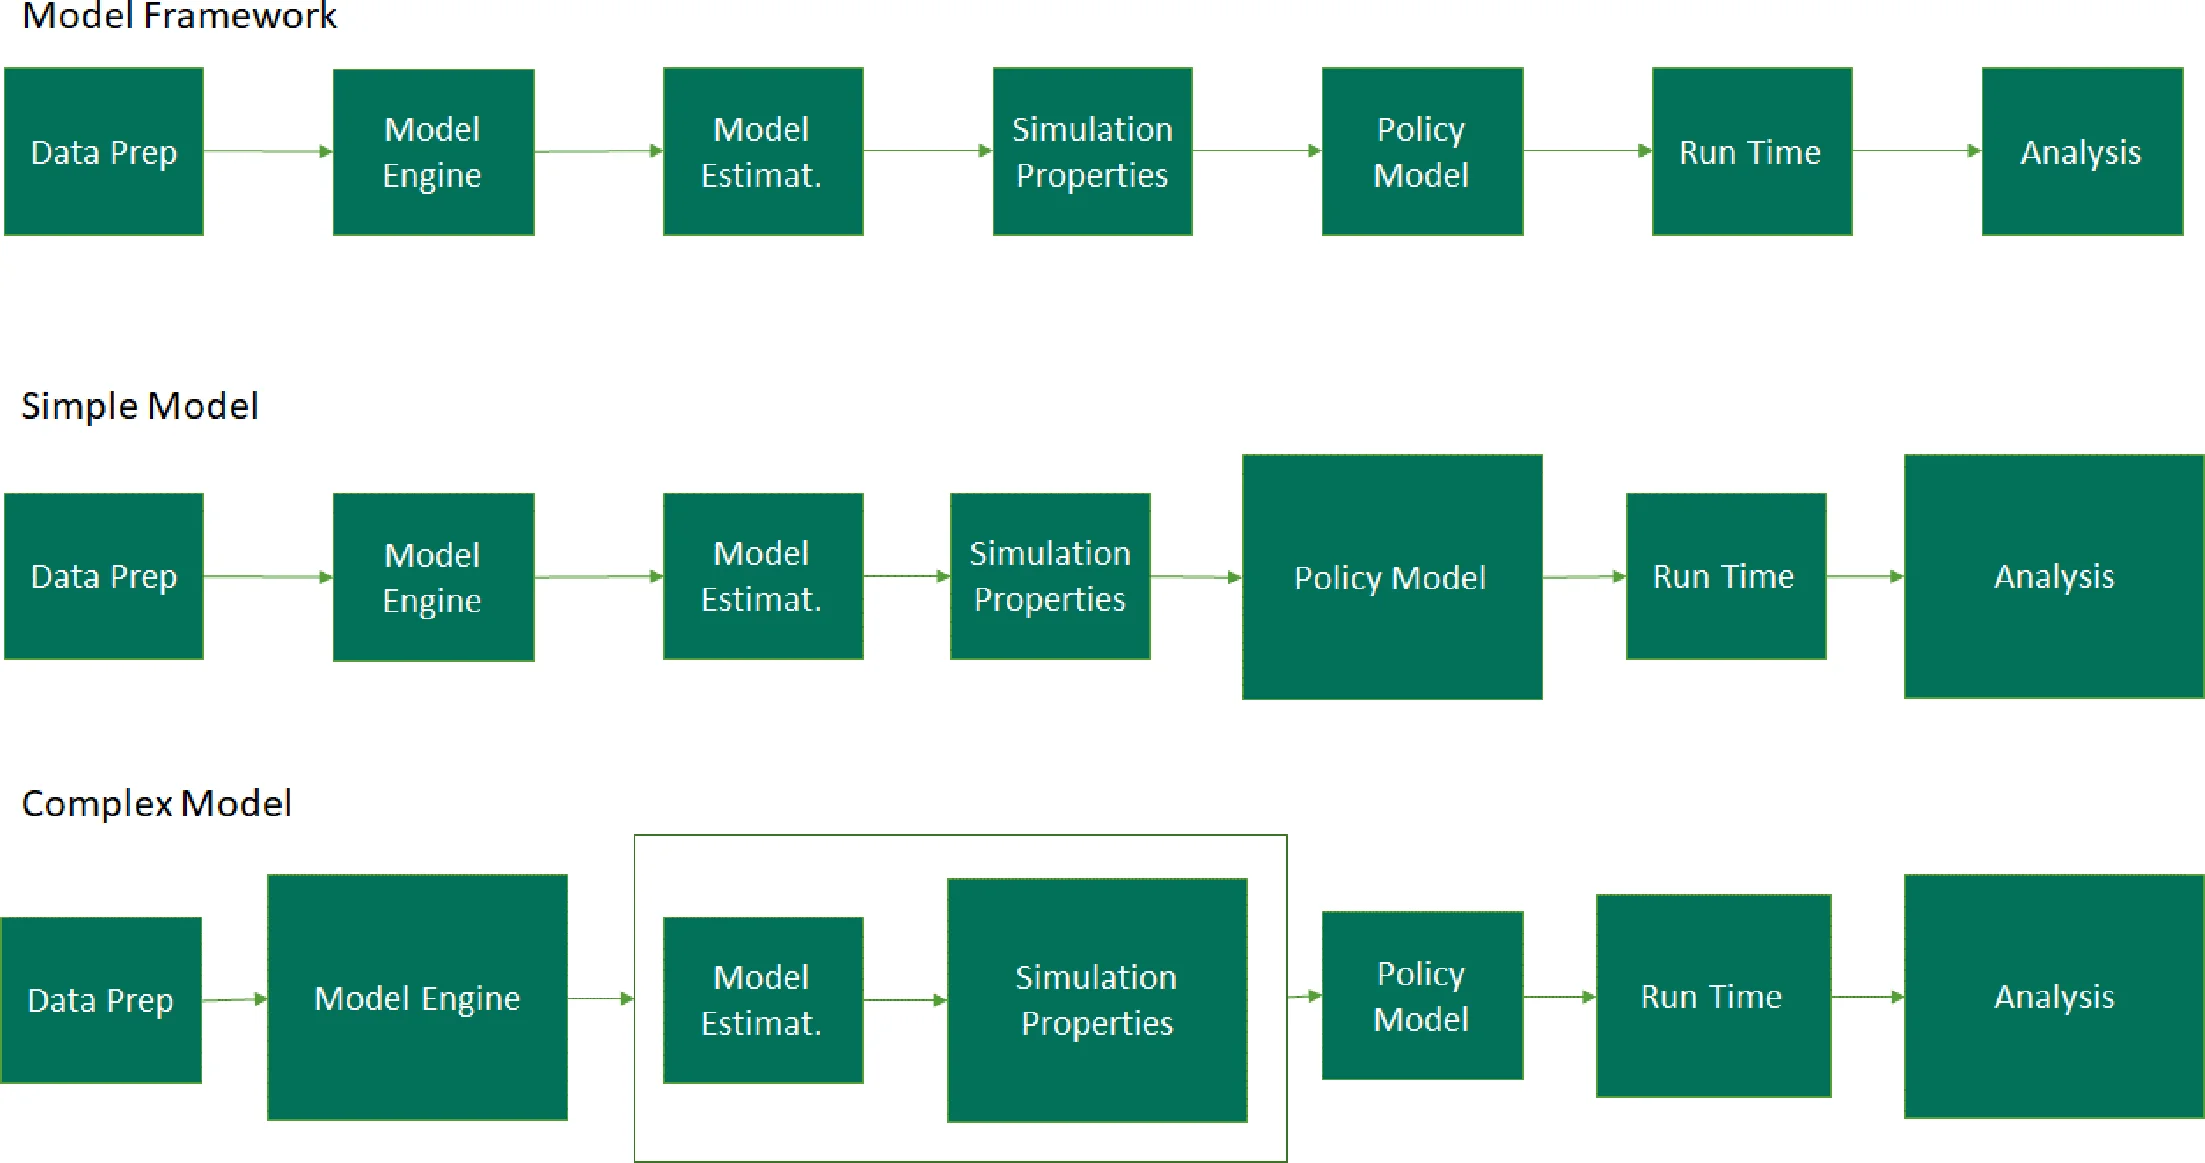
Figure 4 describes a model of the development and modelling time for different parts of a model. Summarising for convenience Figure 2, the aspects that take time consist of:
Data Preparation
Model Engine
Model Estimation
Simulation Properties
Policy Model
Run Time
Analysis
The figure is divided into a simple model and a complex model. The size of the blocks represent the likely time of engagement for a particular component.
In a simple policy focused model (say with a focus on health outcomes), more effort will be put into the policy simulation and analysis, with simpler dynamic simulation components. The creation of the policy model during the development phase and the repetition of analysis as the model is run will take the most time relative to other components, with run-time, the validation of simulation components and the development of the model engine due to the lower burden on infrastructure.
In a more complex framework (as in the case of a pensions model), with more simulated components, the data and process handling becomes more important and analysis remains important. In a more complex model, run-time becomes more important. However, it is likely to be less important than analysis in terms of time. A policy framework is deterministic in nature and so will be relatively less time consuming than stochastic components as the simulation properties of a complex system becomes increasingly important.
Model tools have been created to assist in the development of policy models as in the case of the EUROMOD modelling framework, which contains libraries of policy modules. A lot of work has been undertaken for dynamic micro-simulation model engines as in the case of MODGEN, LIAM2, JASMINE etc. The landscape is much better now than it used to be where earlier models had to “reinvent the wheel” in developing new models. Run-time has improved through the better programming in the generalised frameworks resulting in much faster runs than in the “amateur” model frameworks from earlier (De Menten et al., 2014). In reality however, the analysis time is likely to be longer than the simulation run-time as it can take a lot of time to interpret and validate results. Analysis also typically involves more interactive engagement with the data, while simulations can take place in the background. So in essence, the analytical time is more expensive from the researcher’s point of view. There are opportunities for more off the shelf analytic tools for dynamic microsimulation analysis, however the bulk of the time spent in analysis is in the human interaction, rather than defining the calculations. In addition, most analyses are relatively idiosyncratic, meaning that it can be difficult define in advance.
The last source of time cost is the estimation and evaluation of the simulation properties of the modules within a dynamic microsimulation model. Returning to our parsimony discussion, producing a system of equations that result in realistic simulations is challenging, whether it be plausible heterogeneity, inter-temporal volatility or inertia, particularly when short panels are used in their estimation. Small errors in a single year iteration in inter-temporal simulation can blow up into large errors over the length of a simulation. It is surprising therefore how little effort there has been in sharing this part of the simulation process. In other words, it might be possible to utilise statistical equations from one country in the development of a model for another country. For models that are aligned, and for countries with a similar social and economic structure it is likely that simply varying calibration totals, while using another country’s estimated equations will not lose too much power. This was the approach when the DYNACAN (Morrison, 1997) team started to use the CORSIM (Caldwell et al., 1999) modelling framework, starting initially with US equations and gradually moving to Canadian specific equations over time.
Note the Size of the boxes represent the relative importance of different parts of each model type. They are based upon expert judgement rather empirical investigation.
3. Methodology
As the volume of published information has expanded, there has been a greater need to systematise the review and synthesis of findings across the literature. While I was able to read almost every paper in the field when I undertook a literature review as part of my PhD and published in the first survey (O’Donoghue, 2001), it is now impossible to review in detail the field, given the number of publications.
Synthesising medium and large literatures requires analytical tools of their own, analysing bibliometric data with less detailed reading of the material. Building upon systematic reviews of clinical trial data in the health literature, systematic reviews are now commonly used to synthesise information in published research papers (Gough et al., 2017). They differ from meta-analysis which is a statistical tool to summarise often quantitative results of these papers.
Li and O’Donoghue (2013) attempted to some statistical analysis of bibliometric information. In this paper, we undertake a more formal assessment of the bibliometric data for more recent years and undertake a comparison with the data in the previous paper.
We have performed an analysis using a variant PRISMA approach (Preferred Reporting Items for Systematic reviews and Meta-Analyses) Statements methodology, comprising five steps: (1) data search strategy, (2) data collection, (3) data screening and data cleaning, (4) quantitative and qualitative analysis of the publication output, and (5) interpretation (Moher et al., 2009). In my experience PRISMA is ideal when there is a clear narrow question to be considered. While for more open ended less clear approaches such as describing models is it less helpful. However at the same time the ad hoc approach of most previous survey articles in microsimulation is unsystematic and given the growing field not appropriate. The approach taken here is to draw upon the PRISMA approach in categorising the search using the approach defined, but allowing for both a combination of additional papers that are not picked up by the narrow search, but also to sample or exclude uncited grey literature to keep the sample manageable. One could interpret the approach as PRISMA Lite.
Fundamentally, the research question considered here relates to the use of dynamic microsimulation models during the period 2013-2023. We undertook a Google Scholar search and found 1998 items.
Some systematic reviews rely mainly on bibliometric data alone to undertake the analysis such as key words. However, for the purposes of our study, given our goal to consider methodological choices, there is a need for a deeper examination of the papers rather than merely quantitative bibliometric data. The approach is more of a hybrid one combining mixed quantitative and qualitative methods. In order to restrict the analysis to a manageable set for review, we limit our papers, mainly taking a non-random sample. Weighted by the more highly cited papers while ensuring a good representation of different areas, we selected 198 papers to be reviewed.
However, it should be noted that a random procedure would result in many papers that either working papers or papers that merely cite dynamic microsimulation models. Taking a non-random approach allows me to use my judgement, as a practitioner to select what I feel are the most important papers. As a test, I took a higher proportion of papers for the period 2022-2023 in supplementing an earlier collection effort for 2014-2021. There were no major differences in the overall qualitative conclusions from the analysis.
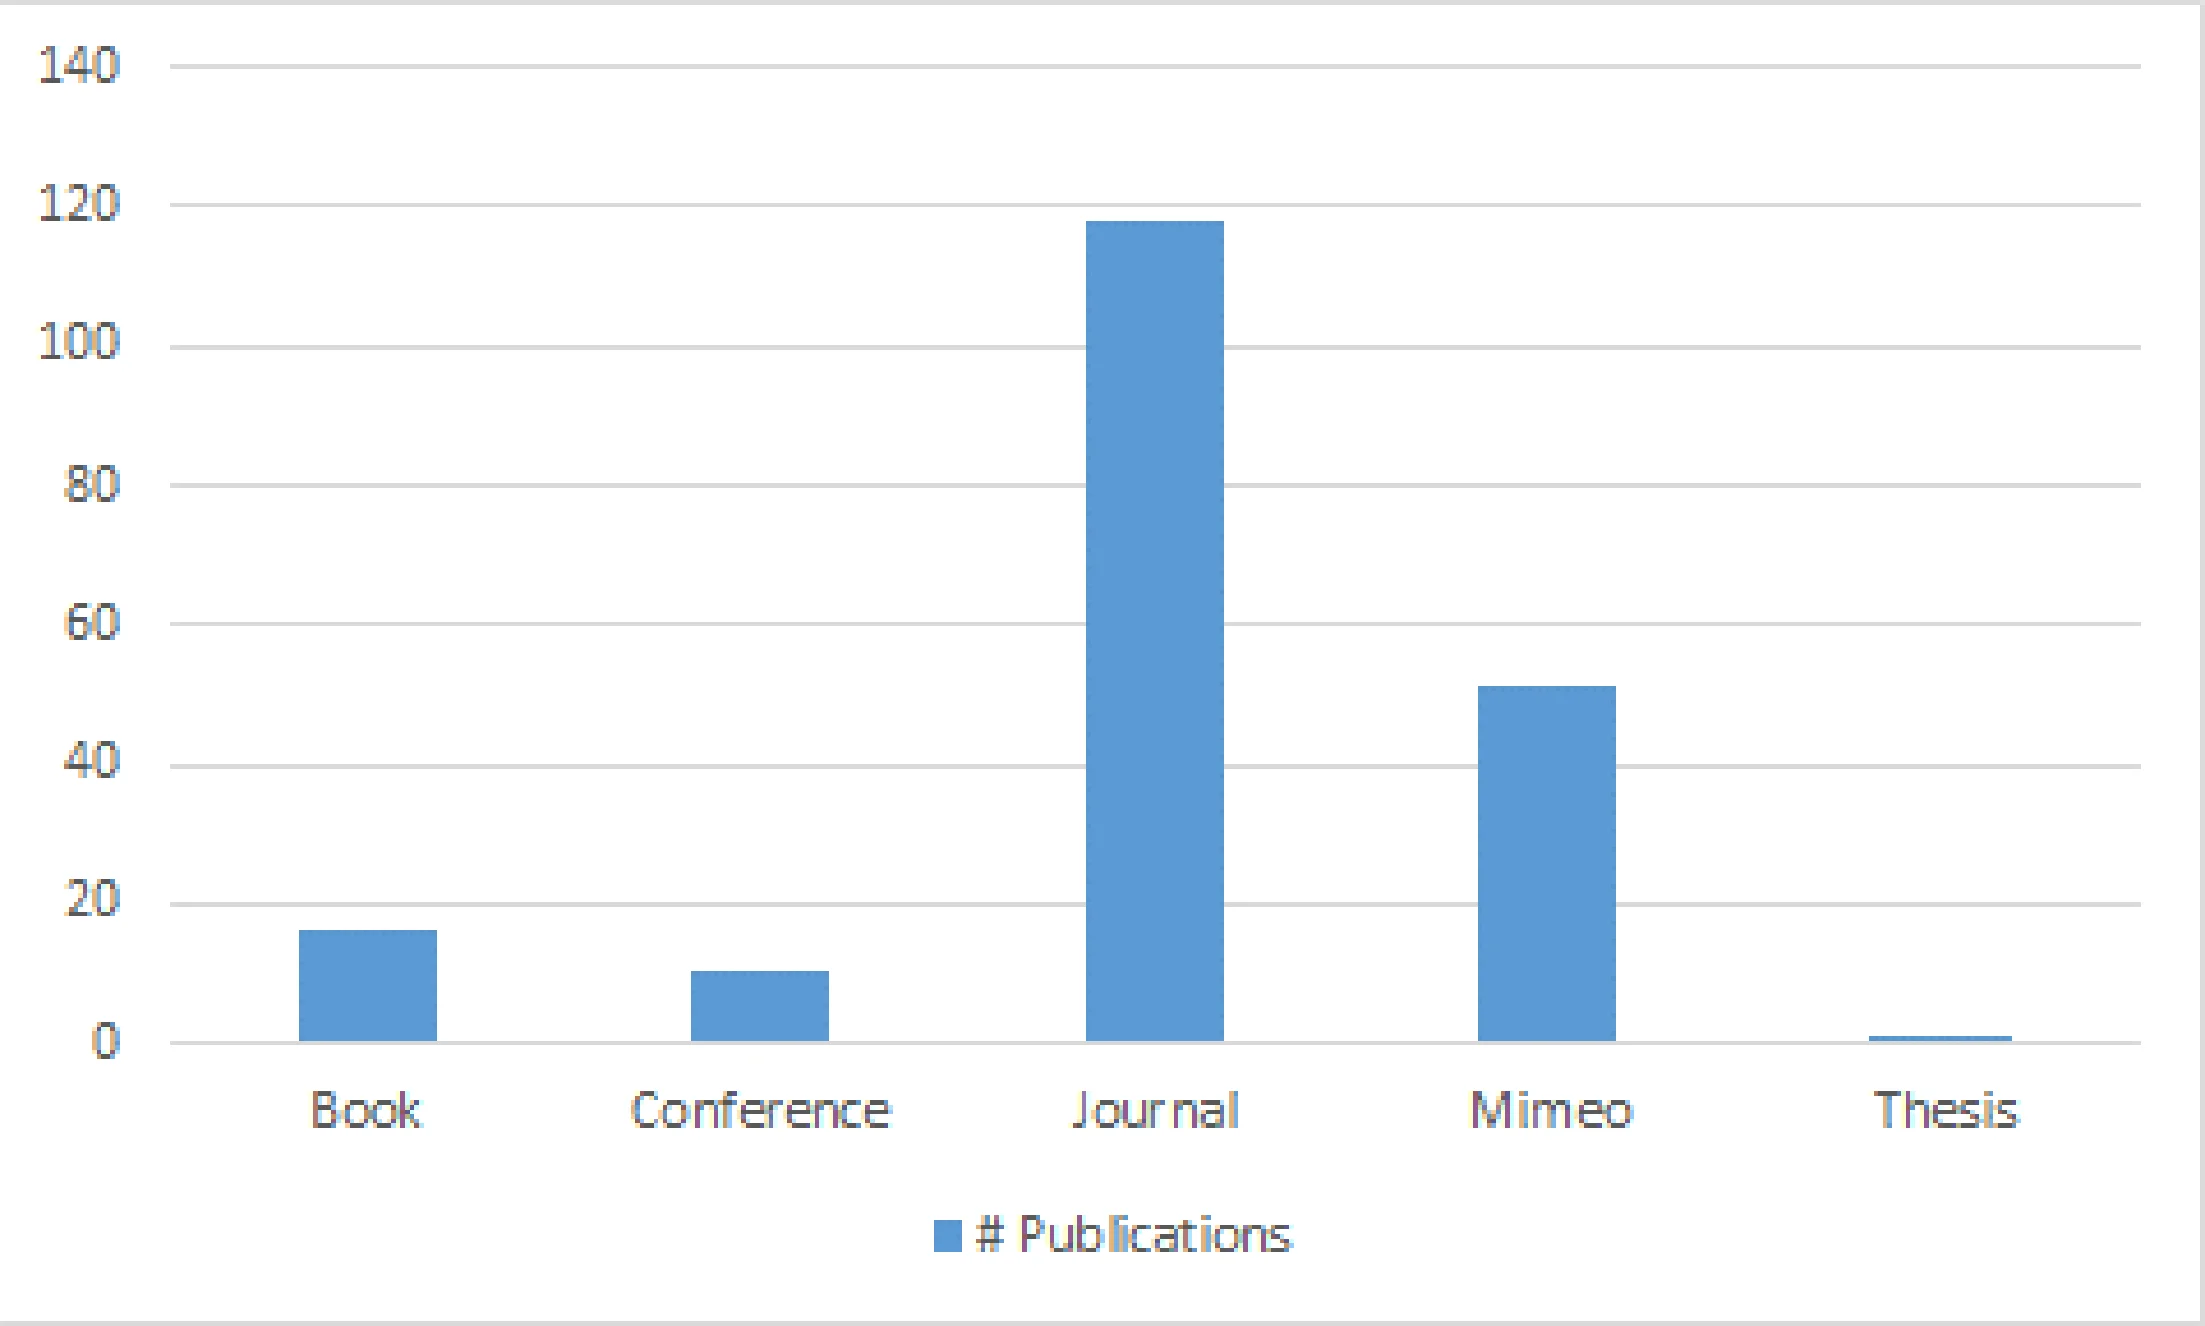
Figure 5 reports the types of publications reviewed in this systematic review. The dominant publication source are journal articles, with mimeo or in-house technical reports being the second most common. Unlike earlier periods, the number of papers published in books or conference proceedings are lower. A number of PhD theses are cited. Relative to other fields, the proportion of non-peer reviewed technical reports is relatively high, with a growing trend, particularly late in the period (2022-2023).
4. Results
In the results section, we report tabulations of various paper characteristics and model choices made by the papers. Where possible we compare the tabulations for the period 2013-2021 with the previous period reviewed in Li and O’Donoghue (2013).
Figure 6 reports the geographic spread of dynamic microsimulation models and analysis comparing the post 2012 period with beforehand. What is very apparent is the increasing range of countries that undertake dynamic microsimulation modelling. Although the totals are not directly comparable the modal countries have more papers using the method. The USA, particularly with the growing interest of dynamic microsimulation of health professionals has the highest number of papers. There is a re-emergence of interest in an early leader in the field, Germany (Nguyen et al., 2024; Münnich et al., 2021; Fischer and Hügle, 2020). There are new papers from countries that have limited backgrounds in microsimulation such as Kenya (Luong Nguyen et al., 2018) or North Macedonia (Petreski and Petreski, 2021). However, there is an ebb and flow of countries as there are fewer analyses from early leaders in dynamic microsimulation such as Sweden, Netherlands and Italy.
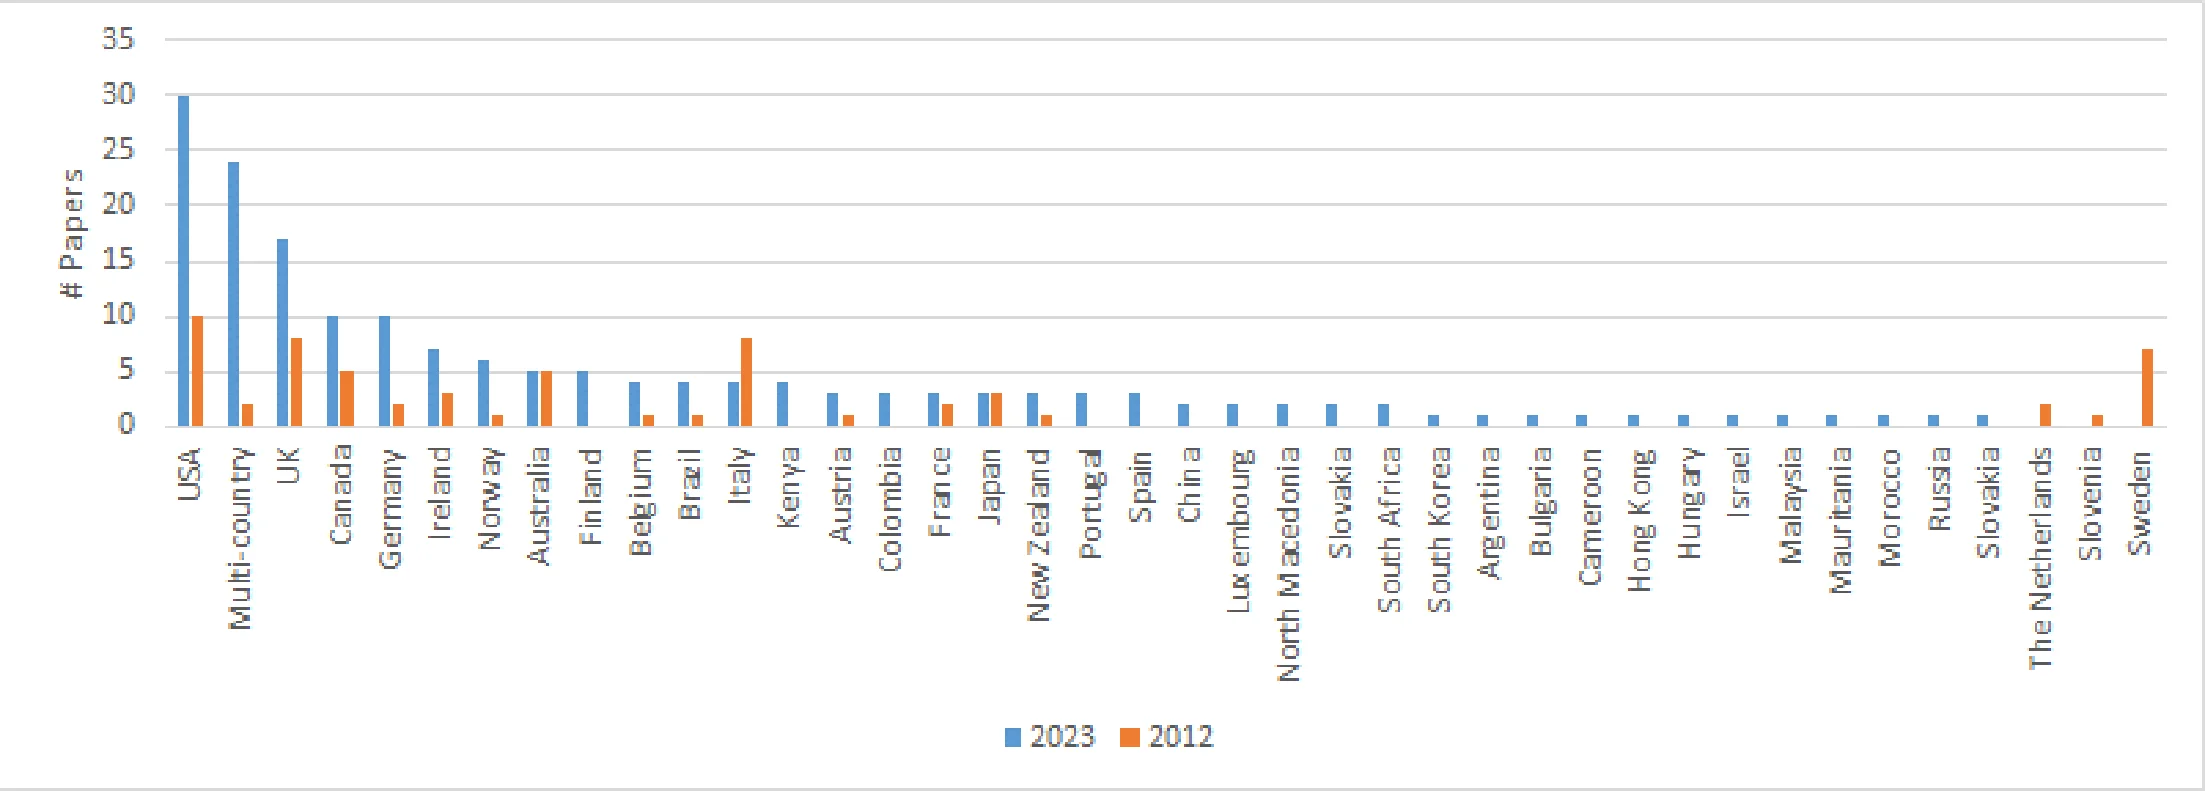
One of the most significant trends is in the increased interest in multi-country comparative analyses (Atella et al., 2017; Dekkers et al., 2022; Spielauer et al., 2020; Rasella et al., 2021). Comparative analyses have spanned different sub-fields, including health, income distribution and pensions. The increase in comparative analysis has developed in a slightly different way to static microsimulation in that it did not evolve by more countries with national models agreeing that they wanted to do a comparative exercise and then developing a comparative framework like EUROMOD (Sutherland and Figari, 2013). Rather many of the comparative frameworks have evolved as distinct projects with an aim to do comparative research.
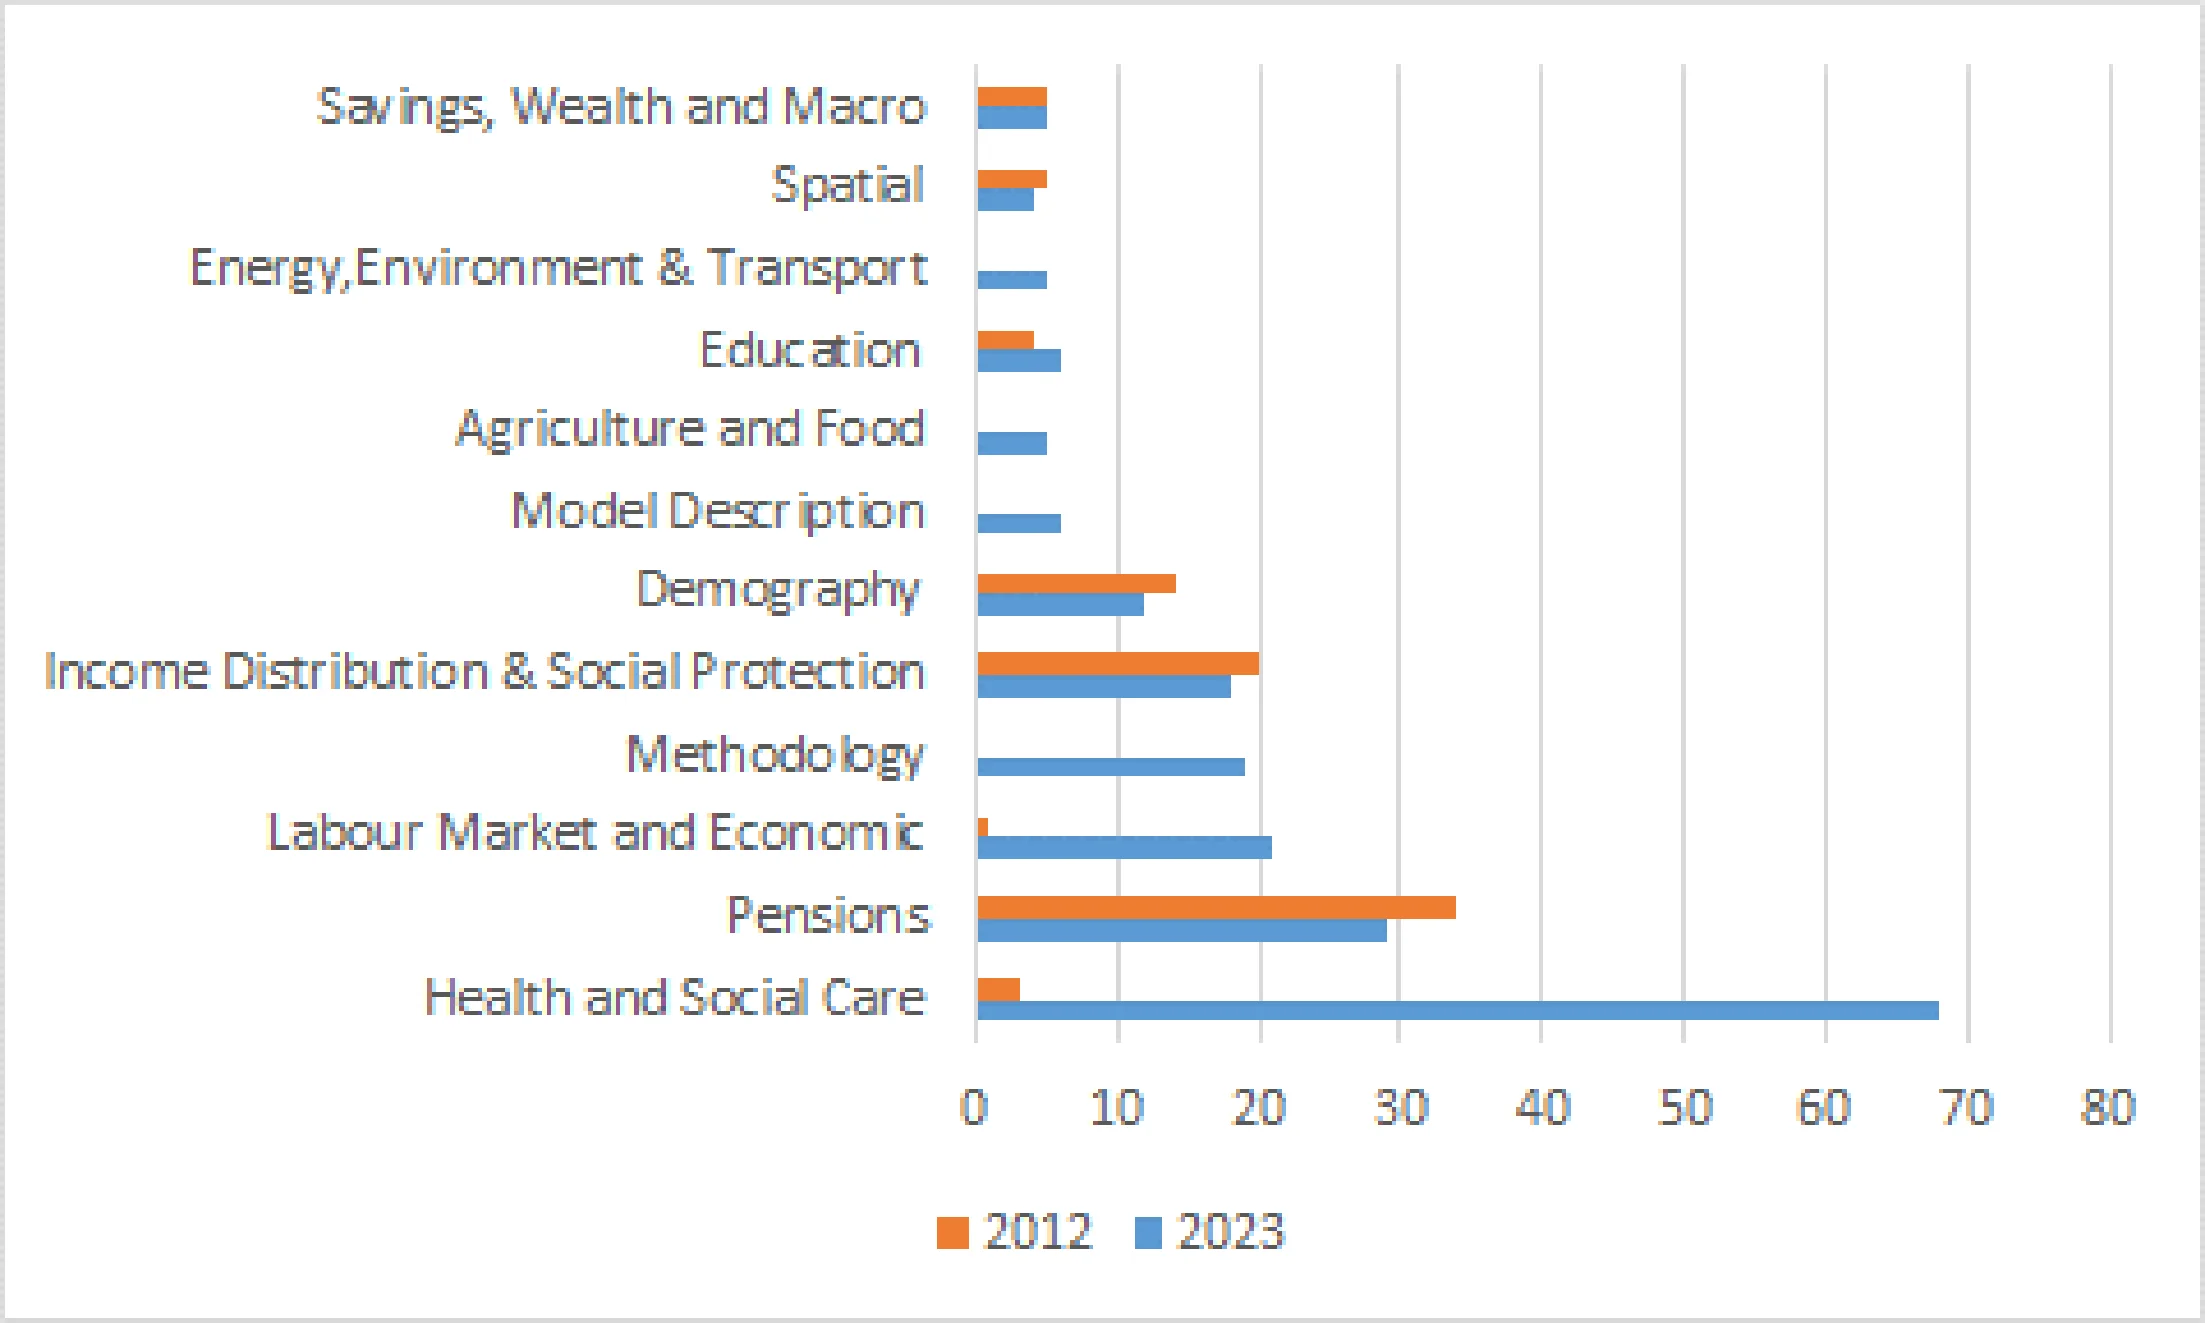
The period since 2013 has seen significant changes in use of dynamic microsimulation models (Figure 7). Like elsewhere in the field, health care modelling has been growing rapidly (Mortari et al., 2020; Pappas et al., 2018). The COVID crisis has spurred a lot of interest (Reddy et al., 2021; O’Donoghue et al., 2020; Spooner et al., 2021). This is reflected in the share of papers at the World Congress of the International Microsimulation Association conducted face to face in 2019 and higher again with a record number of particularly high quality papers in 2023. Labour market analyses have also increased in importance (Calcagno, 2017; Harmon and Miller, 2018; Horvath et al., 2020). There is more interest also in the, environment, energy and agriculture (Montaud et al., 2017; O’Donoghue, 2017; Ryan and O’Donoghue, 2017). Traditional areas such as pensions, inequality and demography (Andreassen et al., 2020) remain important, but have declined since the Li and O’Donoghue (2013) paper, particularly given the longer sample period in this paper.
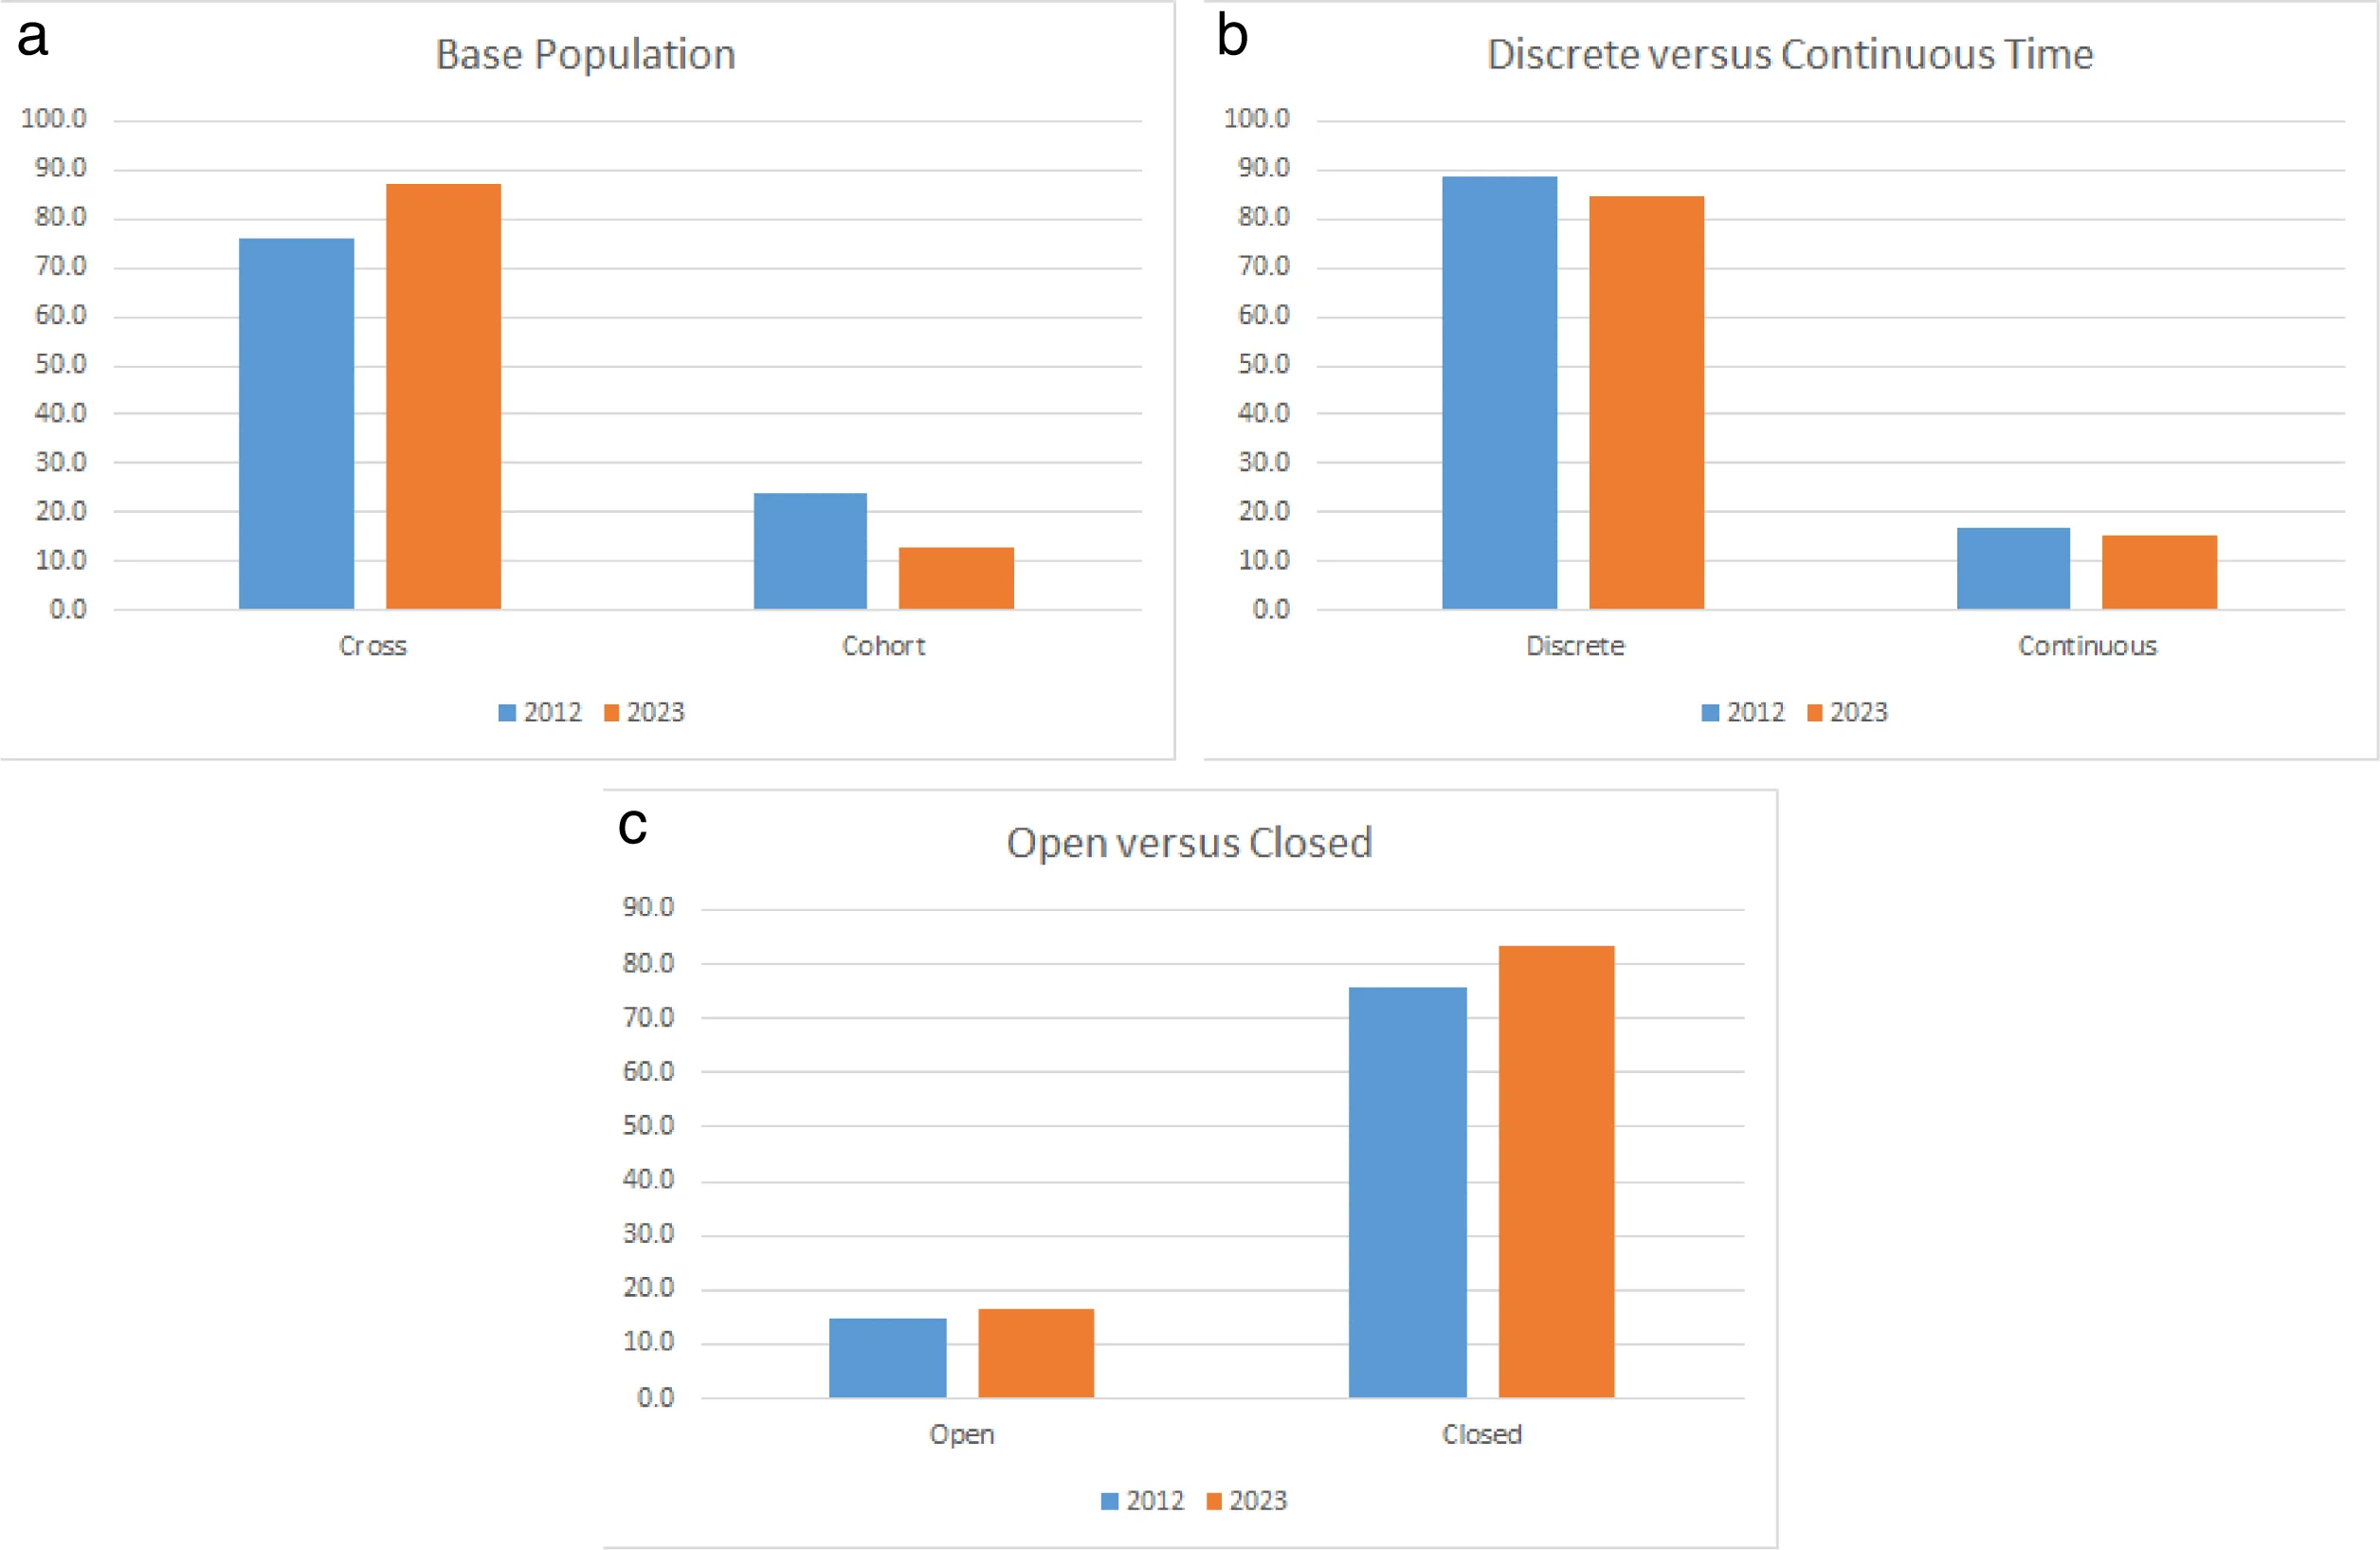
In relation to methodological choices, there has not been much change in the modelling choices over the 2013-2021 period (Figure 8). The field is primarily cross-sectional focused with a slightly higher share than before. Most of the analyses used closed models, but many do not utilise marriage markets, particularly the health models, so the point is less important. The majority of models utilise discrete time transitions, rather than continuous time transitions, with a minor reduction in the latter. In summary the modelling choices of microsimulation models has become simpler and more parsimonious with the increase in health sector modelling.
As health care models, which often focus on central projections of demographic characteristics, with a more detailed focus on health outcome modelling, alignment has decreased very substantially (Figure 9) in use (Mortari et al., 2020; Archer et al., 2021). Also given the more parsimonious approach, behavioural feedback loops have decreased in dynamic microsimulation modelling over the two periods considered.
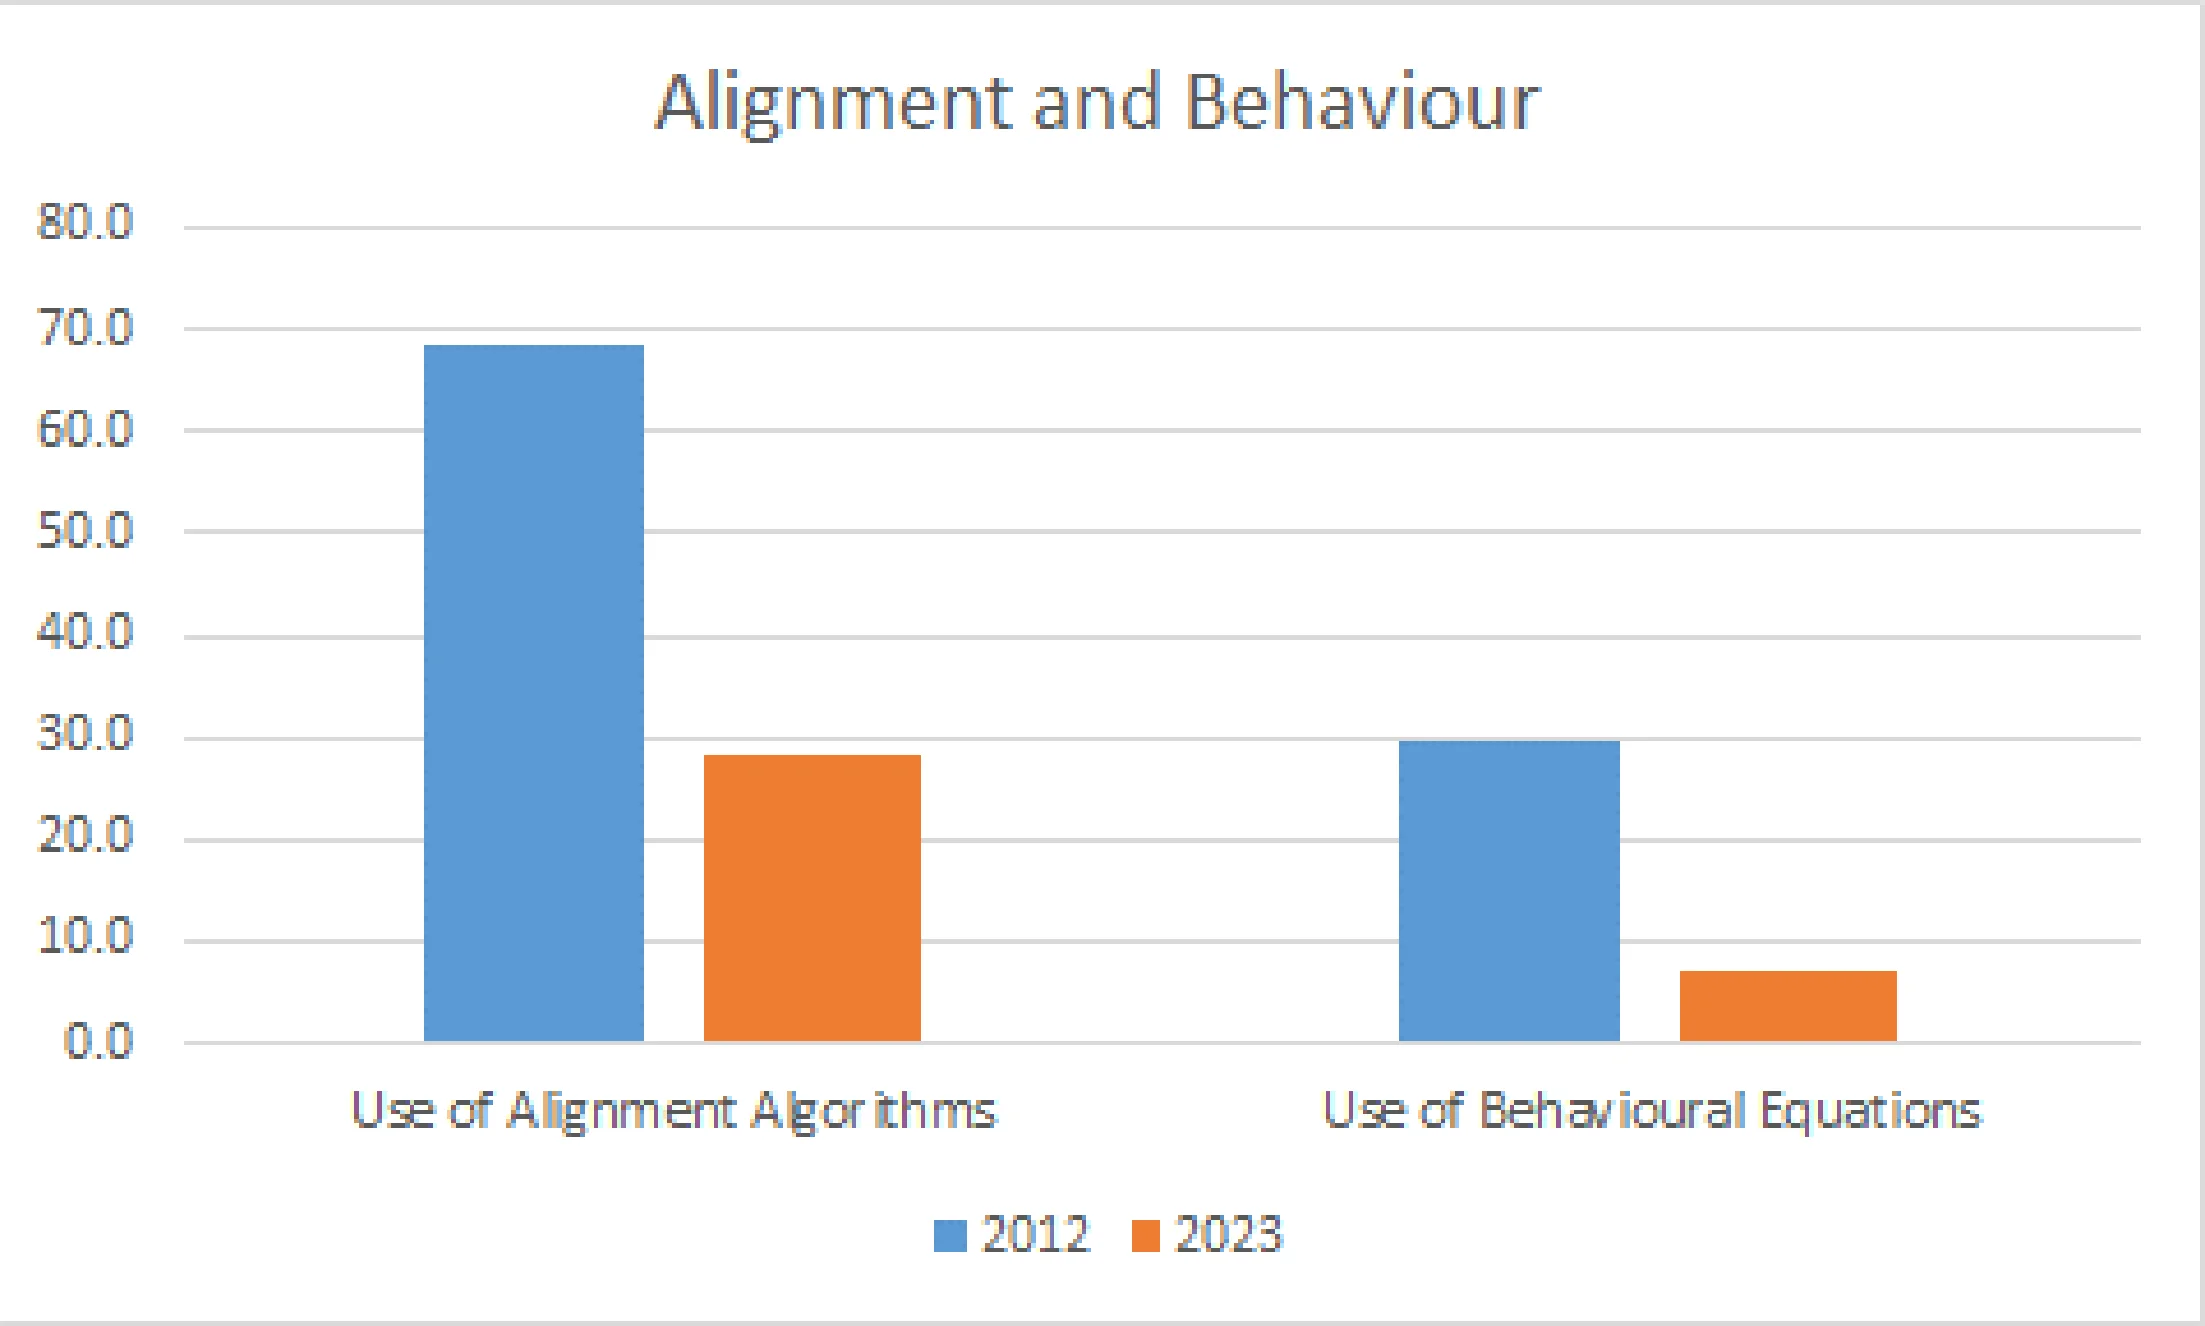
Within the aligned models, the nature of the alignment has changed with an increasing use of computable general equilibrium (CGE) models being used to calibrate micro data (Njoya and Seetaram, 2018). There is also an increased use of dynamic microsimulation methods to undertake nowcasting particularly during the COVID crisis focusing only on cross-sectional distributions, with or without dynamics (Cassells et al., 2006).
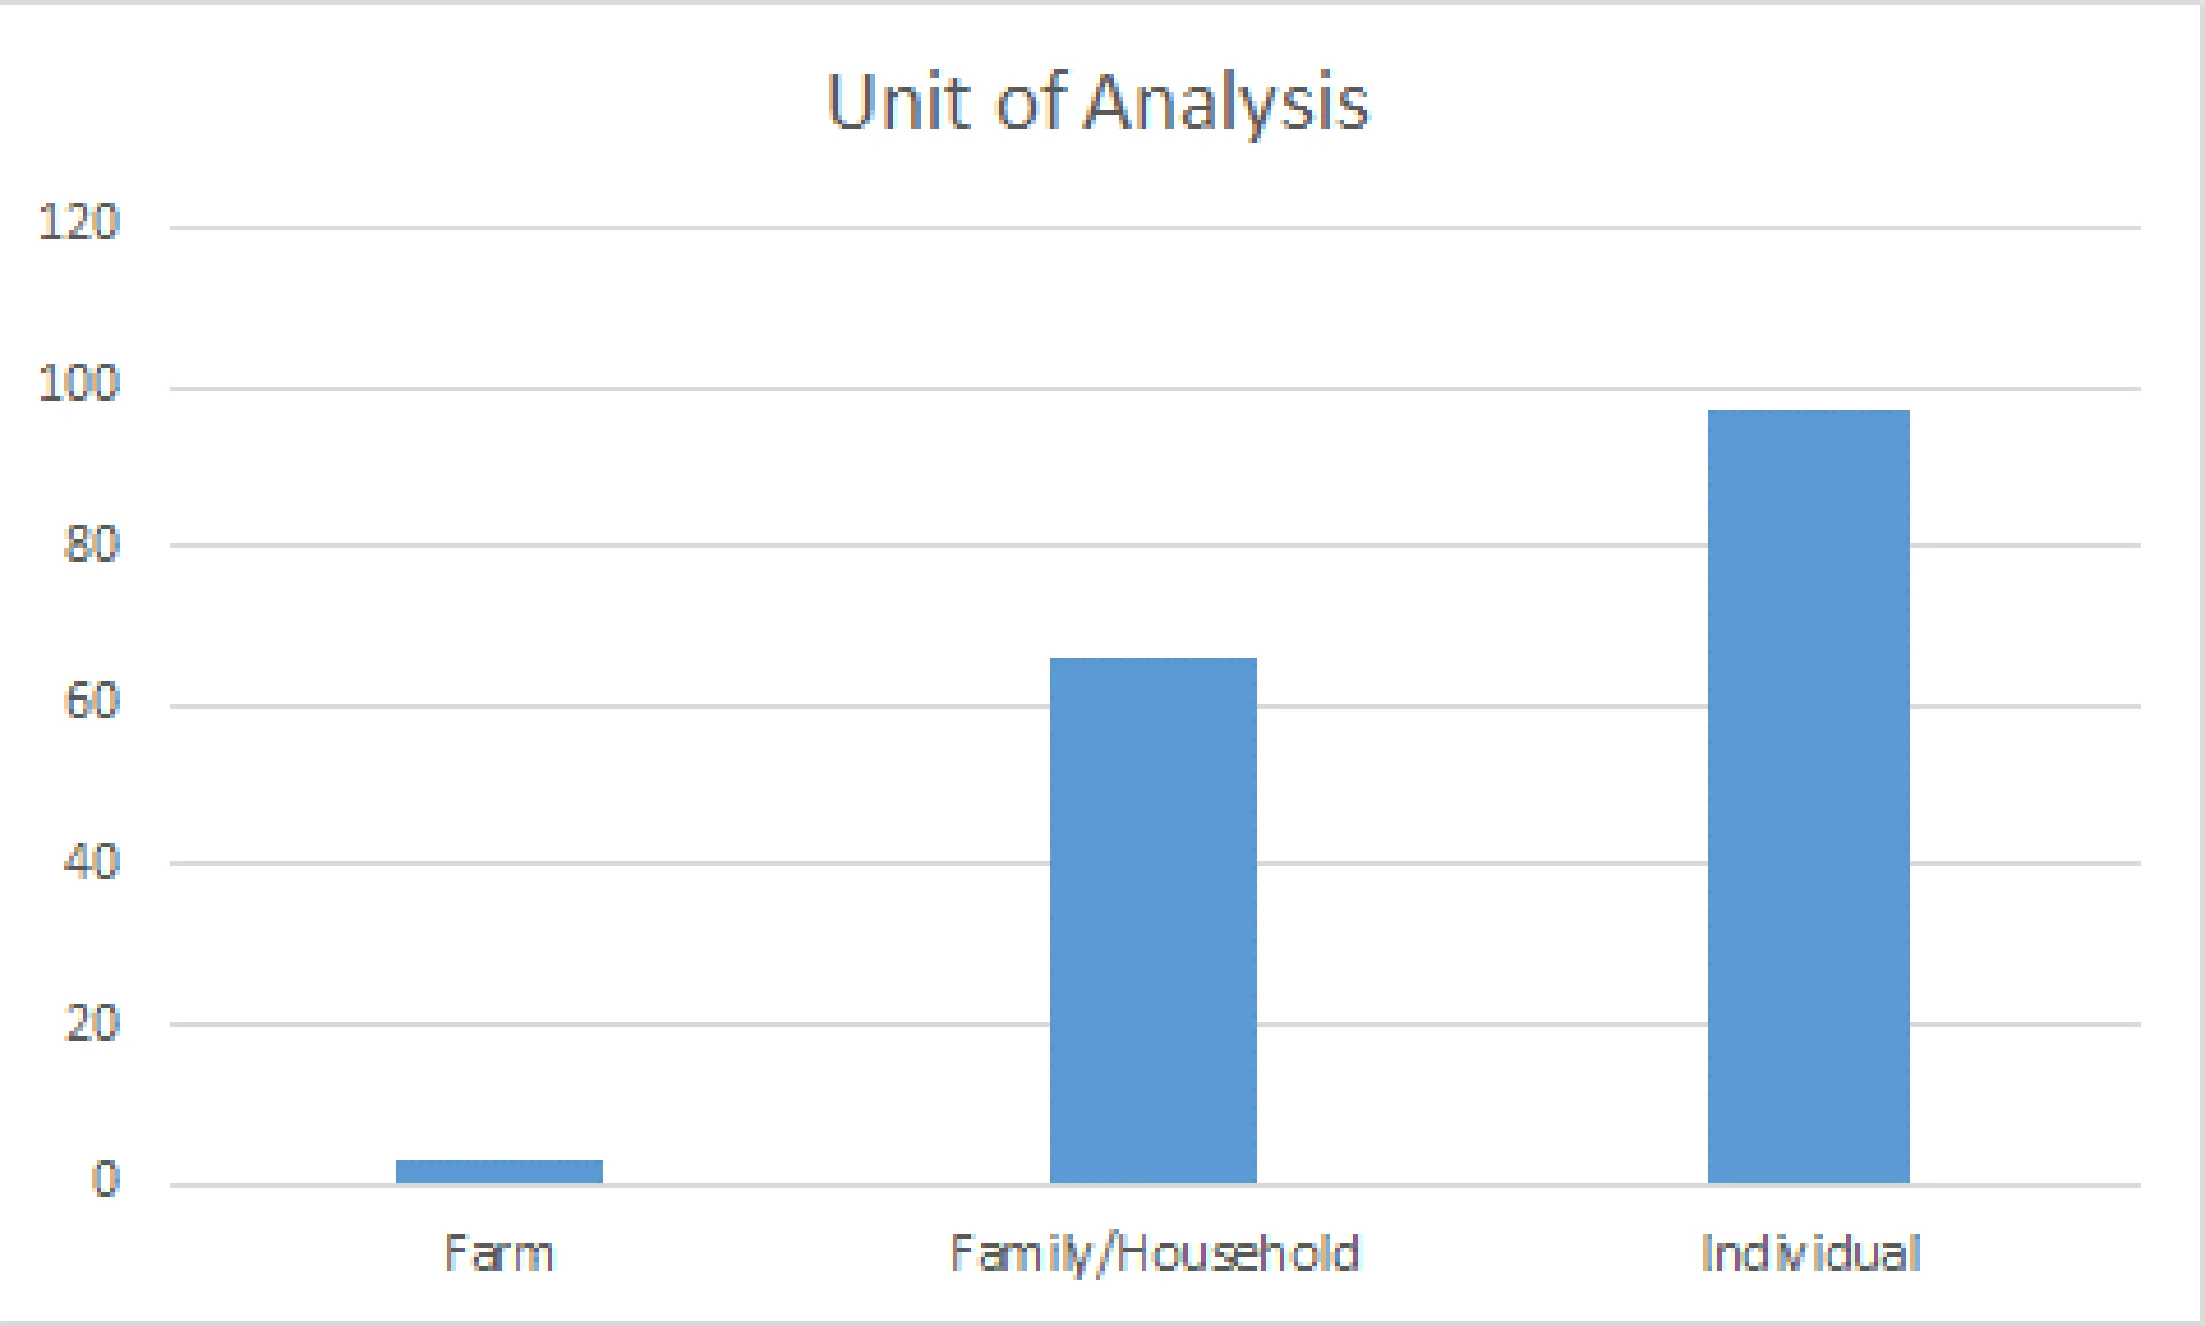
Another difference in trend is the changing unit of analysis used in different papers (Figure 10). There has been a shift towards models with an individual unit of analysis as health papers become more important. The use of farms as a unit of analysis has also appeared as the methodology broadens into environmental and land use issues.
4.1. Impact - bibliometrics
We finish our results by undertaking a citations analysis (Figure 11). While there are a higher number of published papers and an increase in the number of journal articles, nevertheless, there are still a relatively large number of working papers and policy reports. Journal articles have the highest citation scores across publication types, with books and book chapters having the second highest citation score. A particular point to note is that the majority of journal articles on dynamic microsimulation models are occurring in mainstream health and social science journals with only 15 of the 118 journal articles considered in this review being published in a simulation journal. Worryingly the large number of technical reports and lesser number of conference papers have a lower citation record even than hard to access PhD these.
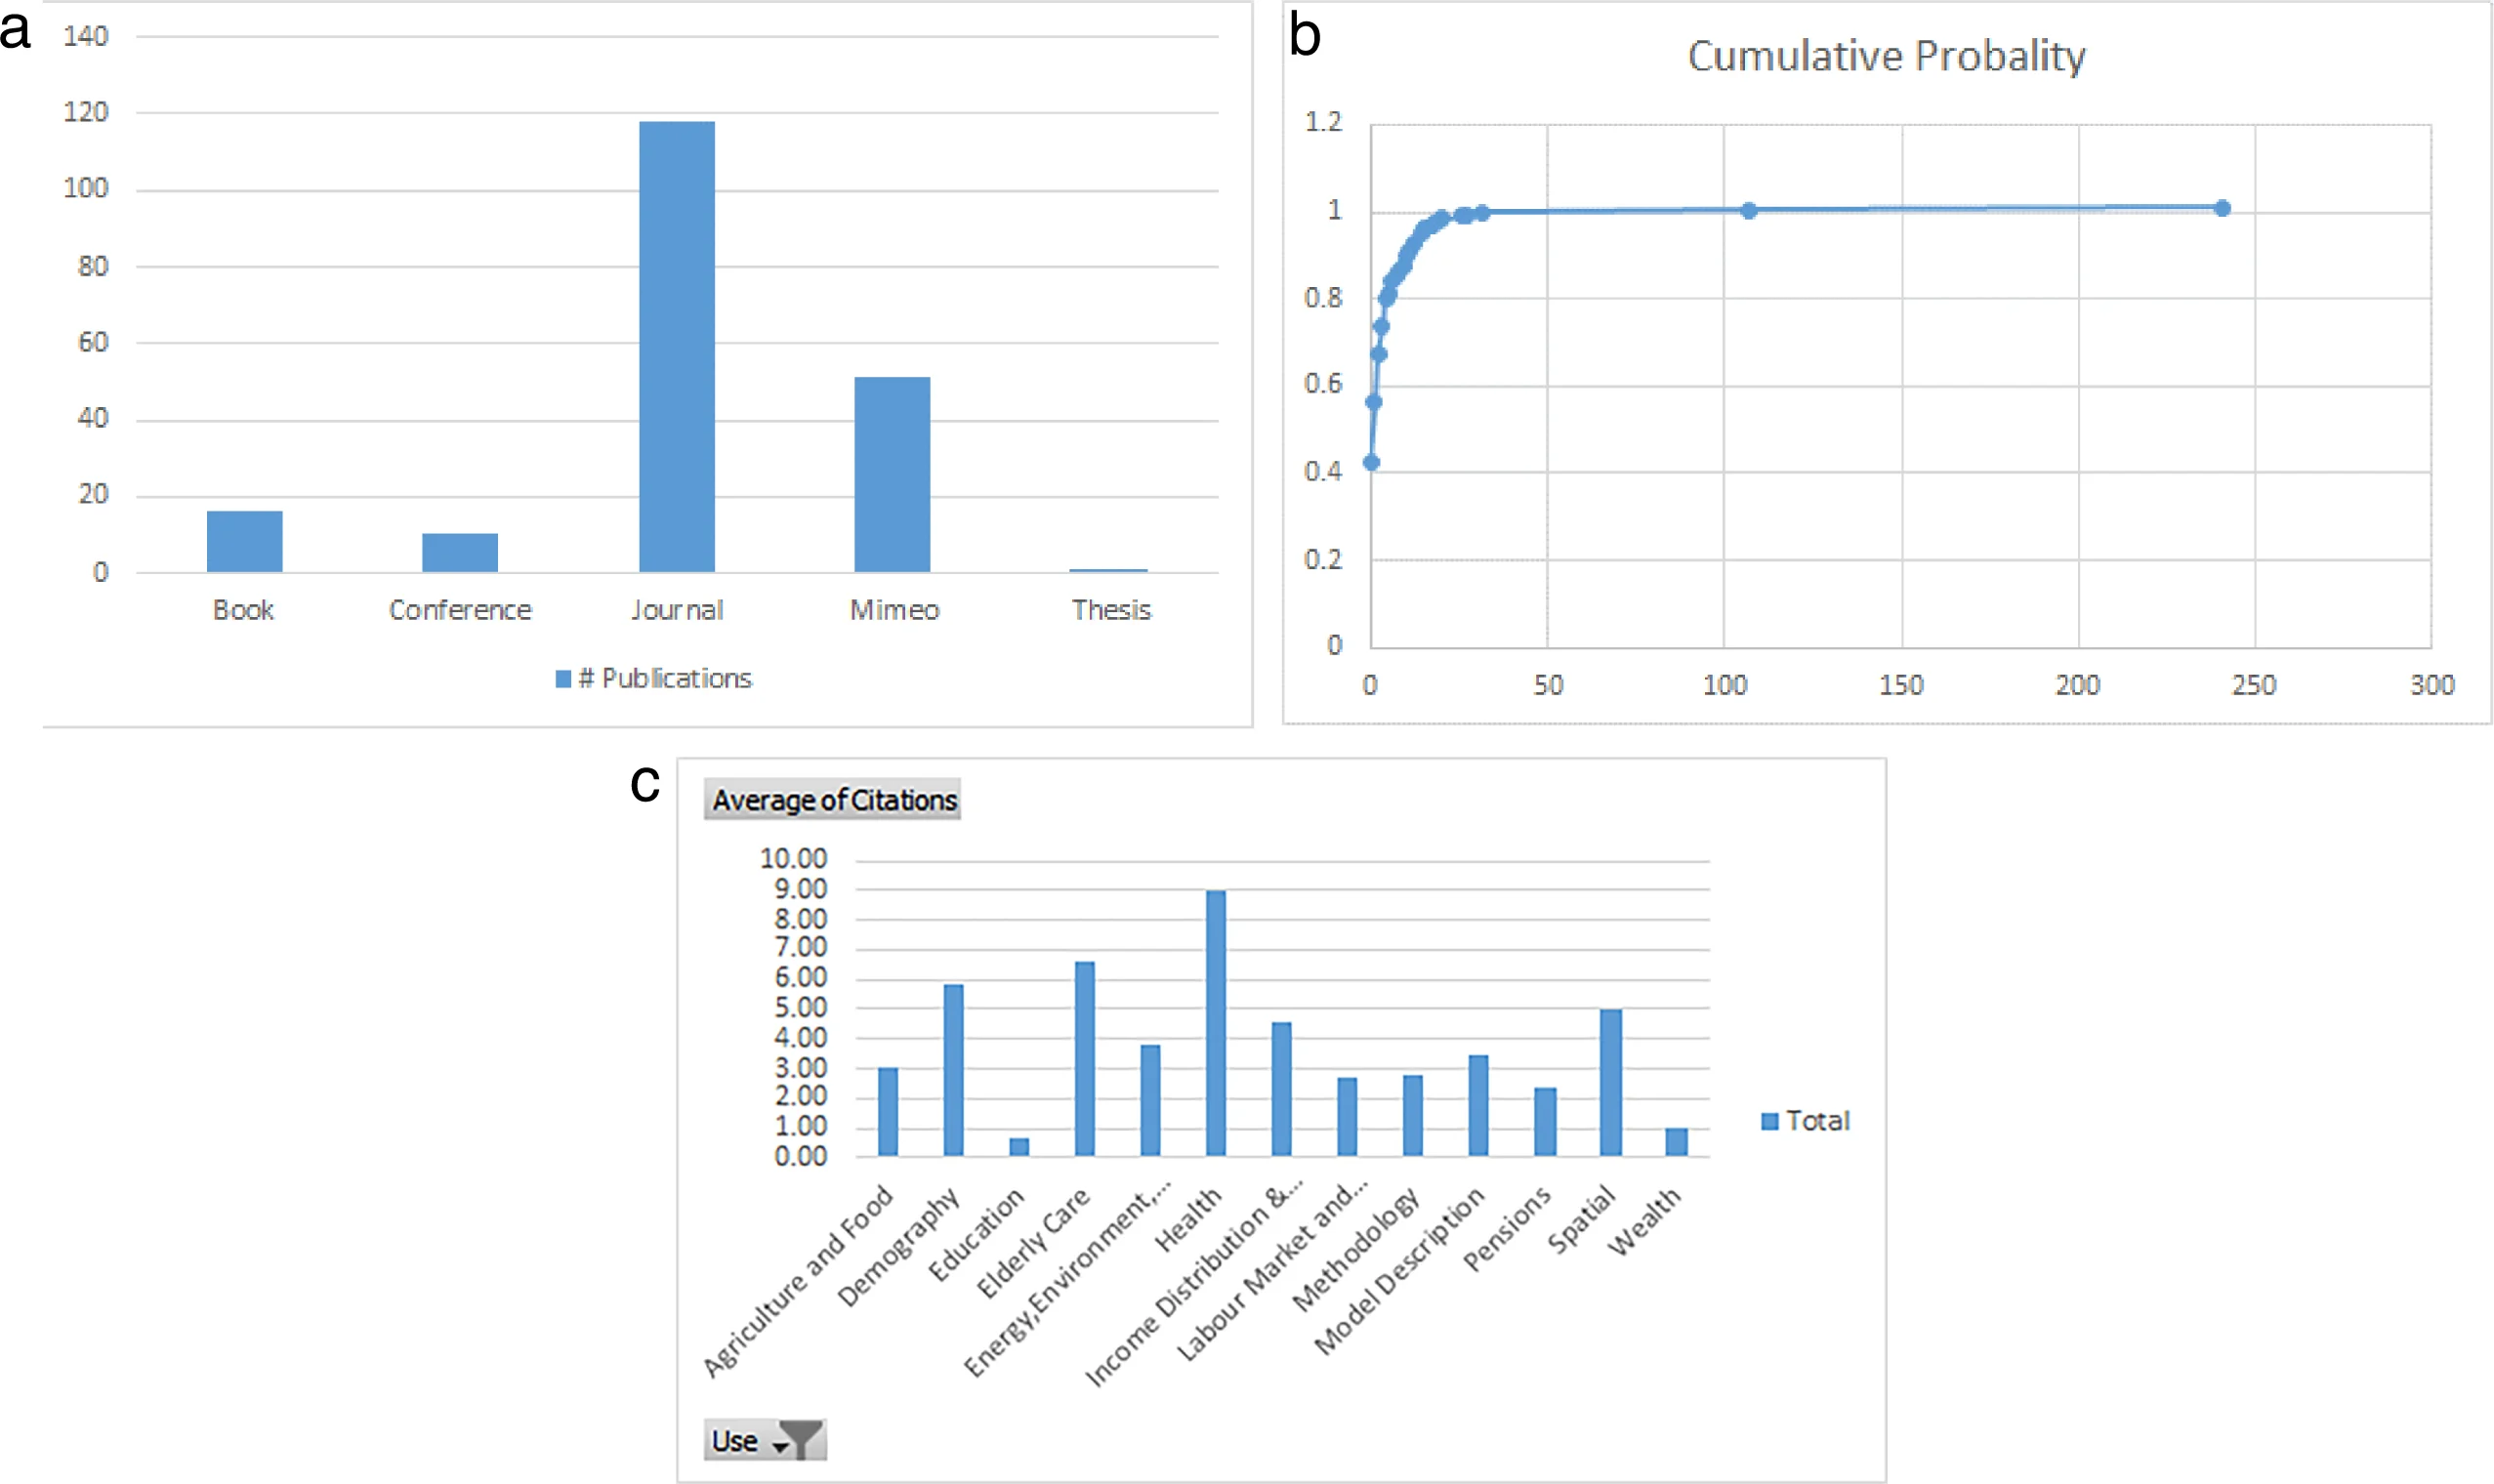
It is interesting to note that relationship between citations and publication type varies by application (Table 2). In most applications, the journal, non-journal dichotomy is very clear such as Health, Agriculture, Model Description and Income Distribution. However, for some areas such as Energy, Pensions, Elderly Care and Spatial this does not hold. There may be a time element in this result, given the increasing share of journal papers in some of these areas such as elderly care later in the period with lower citation levels given their recent publication. Some areas, such as pensions are more policy dominated with a consequentially lower citation rate on average, but with less difference between publication type.
| Application | Journal | Other | Total |
|---|---|---|---|
| Agriculture and Food | 12.0 | 0.8 | 3.0 |
| Demography | 4.2 | 7.8 | 5.8 |
| Education | 0.5 | 1.0 | 0.7 |
| Elderly Care | 5.4 | 8.7 | 6.6 |
| Energy,Environment, Transport and Land Use | 3.3 | 4.5 | 3.8 |
| Health | 13.4 | 0.5 | 8.9 |
| Income Distribution & Social Protection | 10.8 | 0.8 | 4.6 |
| Labour Market and Economic | 3.5 | 1.1 | 2.7 |
| Methodology | 3.7 | 1.3 | 2.8 |
| Model Description | 20.0 | 0.2 | 3.5 |
| Pensions | 2.5 | 2.1 | 2.3 |
| Spatial | 1.5 | 8.5 | 5.0 |
| Wealth | 1.0 | 1.0 |
5. Discussion and conclusions
In this paper, we have undertaken an updated review of dynamic microsimulation models covering the period 2013-2023. The sub-field has continued to expand, albeit at a lower rate than the wider field of microsimulation, in part be due to the relative technical difficulty of dynamic microsimulation. However, the broadening reach is very positive with many non-traditional countries for microsimulation, outside of the OECD, using the field.
There has been a clear change in direction over the past 10 years. Previous research could be classified in two clusters, largely divided into closed, aligned, discrete time and open, non-aligned continuous time frameworks, both with family units of analysis. However, the dominant current direction in the field has been the introduction of more parsimonious model particularly in the health sphere. These papers typically use an individual unit of analysis, are non-aligned and have simpler behavioural and simulation structures, with a greater focus on the particular health policy application. The nowcasting models have also adopted the strengths of the dynamic microsimulation approach, but simplifying to make them relevant during analysis of crises. To some extent the papers represented in the IMA World Congress to do not reflect the changed direction of the field, with a higher proportion of papers reflecting the traditional maximal model approach compared with the more parsimonious approach found in journal articles.
In practical terms, from the point of dynamic microsimulation models, what does this mean? In my experience, advising various teams and in doing my own work, there has been a tendency to build in complexity, so to consider what potential uses the model might have rather than what is sufficient now. Frequently models do not survive long enough to realise all of the potential gains from the model. Many of models and institutions that were prominent in the last systematic review prepared in 2013/4 are no longer there such as NATSEM, CORSIM and DYNACAN. As a result, inbuilt flexibility is not always exploited.
What we can see from the current literature is the increasing simplification of models in terms of focus on single applications, use of individual units of analysis rather than household units of analysis, treating more variables either as exogenous outside of the model system or modelling variables such as incomes in aggregate. There are some applications that require the disaggregation of individuals within households and disposable income into income components, such survivorship or gender gaps (Kirn and Dekkers, 2023). However the question needs to be asked, does every application require full flexibility and complexity.
There are clear lessons for the wider field in the approach of this new cluster. They focus on being complex enough, rather than trying to maximise the range and functionality of the model. As a result, of this parsimony, they are easier and quicker to develop. They are easier to link to other modelling frameworks such as CGE models. It strikes me that it might be more efficient to focus on outcome-focused models that more targeted than to develop the large comprehensive modelling framework, requiring large resources.
The advent of this new cluster has happened with large gaps remaining in the literature. The field is still light on defining and evaluating the methodologies used in the field. From alignment to information to support decisions in relation to the where efficiencies can be realised in development to demographic processes to policy endogenous behaviour to simulation properties, there are many unanswered questions. As a result, modelling decisions are often relatively ad hoc. While the new cluster is agile and impactful, the evaluation of the simulation properties of the models are very limited.
In starting this paper, I started with the familiar classification of dynamic microsimulation models into traditional characterisations. To some extent between pre-1990 and O’Donoghue (2001) and Li and O’Donoghue (2013), this classification remained appropriate. This traditional approach informed my priors in analysing the current trends. However, what is clear from the analysis of the published papers, particularly in the latter part of the decade, is that field is moving rapidly away from the traditional classification as the field has moved away from almost an exclusively household income distribution perspective. It is a reflection on the progress of the field, which had been a worry in Li and O’Donoghue (2013), that these priors no longer hold. If there were to be a further iterations of these systematic reviews, I think the focus of the review would change somewhat, what a much greater focus on time and less on the complexity assumed in at the outset of this work.
In terms of future development, my sense is that the trajectory the field is on what rapidly growing number of papers that look at dynamics and inter-temporal trends. There is a merit in more methodological work to be undertaken to support the volume of applications that test and analyse the simulation properties of these models.
The challenge of sustaining future retirement cohorts will grow as populations age. This enhances the demand for larger scale models. However, the costs remain large. The impact of issues such as housing costs will in fact add to the complexity required. Is there a way forward for teams and agencies without access to these large scale resources? It may however be that increasing use of static ageing techniques or calibrated cross-sections (as in nowcasting) combined with dynamic ageing to provide histories might help to reduce the computational complexity of dealing with these issues. Static ageing has been dismissed as a methodology for pensions analysis. There may be merits in assessing a combination of simpler individual focused career trajectories combined with static aged household structures as an intermediate solution to these diverging trends. An advantage of this approach, used in nowcasting is that scenario analyses or foresight type analyses can be undertaken without the overhead of doing longitudinal simulations of full cross-sections.
Finally, while there have been great strides made in the peer review of publications and publishing papers in internationally accessible formats, the volume of papers that are published without peer review remains a worry from the point of view of scientific quality control and also in relation to access. This has a major impact on average citation scores. The new cluster are much more likely to be published in journals, particularly health journals and have higher citation rates. There is a merit in finding a peer reviewed home with the International Journal of Microsimulation of many of these technical documents.
Footnotes
1.
Zaidi and Rake (2001) did a review of a subset of models, while Harding (2007) presented a plenary conference paper on challenges and opportunities of dynamic microsimulation modelling.
2.
Appendix 1
Papers Considered for Bibliometric Exercise
The following papers are data points from the bibliometric analysis:
Abbasi, A., Nasiri Aghdam, A. 2024. Evaluating the impacts of retirement age reform on financial status of the Iranian Social Security Organization using a dynamic microsimulation model. Social Welfare Quarterly, (91), pp. 0–0.
Adepeju, M.O., Evans, A. 2018. A dynamic microsimulation framework for generating synthetic spatiotemporal crime patterns. GISRUK 2018 Proceedings, Leeds.
Aktas, A., Poblete-Cazenave, M., Pachauri, S. 2022. Quantifying the impacts of clean cooking transitions on future health-age trajectories in South Africa. Environmental Research Letters, 17(5), pp. 055001.
An, R., Zheng, J., Xiang, X. 2022. Projecting the influence of sugar-sweetened beverage warning labels and restaurant menu labeling regulations on energy intake, weight status, and health care expenditures in US adults: a microsimulation. Journal of the Academy of Nutrition and Dietetics, 122(2), pp. 334–344.
Andreassen, L., Fredriksen, D., Gjefsen, H.M., Halvorsen, E., Stølen, N.M. 2020. The dynamic cross-sectional microsimulation model MOSART. International Journal of Microsimulation, 13(1), pp. 97–119.
Aransiola, T.J., Ordoñez, J.A., Cavalcanti, D.M., de Sampaio Morais, G.A., de Oliveira Ramos, D., Rasella, D. 2023. The combined effect of social pensions and cash transfers on child mortality: evaluating the last two decades in Brazil and projecting their mitigating effect during the global economic crisis. The Lancet Regional Health – Americas, 27.
Arzamastsev, S.A., Leonenko, V.N. 2020. A demographic microsimulation model for the long-term evolution of synthetic populations in Saint-Petersburg. Matematicheskaya Biologiya i Bioinformatika, pp. 157–161.
Asher, M., Lomax, N., Morrissey, K., Spooner, F., Malleson, N. 2023. Dynamic calibration with approximate Bayesian computation for a microsimulation of disease spread. Scientific Reports, 13, pp. 8637.
Atella, V., Belotti, F., Carrino, L., Piano Mortari, A. 2017. The future of long-term care in Europe: An investigation using a dynamic microsimulation model. CEIS Working Paper, No. 405.
Atella, V., Belotti, F., Kim, D., Goldman, D., Gracner, T., Piano Mortari, A., Tysinger, B. 2020. The future of the elderly population health status: filling a knowledge gap. Unpublished Manuscript.
Azevedo, A.B., Moreira, A., Manso, L., Nicola, R. 2018. Demographic ageing and the Portuguese pension system: Evidence from a dynamic microsimulation model. European Population Conference 2018, EAPS.
Baggett, T.P., Scott, J.A., Le, M.H., Shebl, F.M., Panella, C., Losina, E., Flanagan, C., Gaeta, J.M., Neilan, A., Hyle, E.P., Mohareb, A. 2020. Management strategies for people experiencing sheltered homelessness during the COVID-19 pandemic: clinical outcomes and costs.
Baggett, T.P., Scott, J.A., Le, M.H., Shebl, F.M., Panella, C., Losina, E. Freedberg, K.A. 2020. Management strategies for people experiencing sheltered homelessness during the COVID-19 pandemic: clinical outcomes and costs. JAMA Network Open.
Ballas, D., Broomhead, T., Jones, P.M. 2019. Spatial microsimulation and agent-based modelling. The Practice of Spatial Analysis, pp. 69–84.
Bastian, B., Smith, M., Cheong, B., Pineda, V., Stevenson, M., Hutchison, O., Kluth, S. 2017. Development of Treasury’s new model of Australian retirement incomes and assets: MARIA. Treasury Working Paper, No. 2017-02.
Bavaro, M., Boscolo, S., Tedeschi, S. n.d. Simulating long-run wealth distribution and transmission: the role of inter-generational transfers in Italy. Unpublished Manuscript.
Bekalarczyk, P.S.D. n.d. On the prognosis of third generation migrants’ occupational status in Germany – a dynamic microsimulation. International Journal of Microsimulation Modelling, pp. 95.
Bélanger, A. 2018. Emerging issues in the life cycle perspective in the context of population peaking. Canadian Studies in Population, 45(1–2), pp. 11–18.
Bélanger, A., Mazza, J., Sabourin, P. 2022. Demographic microsimulation for the estimation of the fiscal impacts of immigration and ageing in Europe. Luxembourg: Publications Office of the European Union.
Bélanger, A., Sabourin, P., Bélanger, A. 2017. Microsimulation and Population Dynamics. Springer.
Belkouch, H. 2019. Extension de la couverture sociale et réforme du système de retraite au Maroc. Doctoral dissertation, Paris 10.
Belmonte, M., Grubanov-Boskovic, S., Natale, F., Conte, A., Belanger, A., Sabourin, P. 2023. Demographic microsimulation of long-term care needs in the European Union. Unpublished Manuscript.
Birkin, M., Wu, B., Rees, P. 2017. Moses: dynamic spatial microsimulation with demographic interactions. New Frontiers in Microsimulation Modelling. Routledge, pp. 53–77.
Böheim, R., Horvath, T., Leoni, T., Spielauer, M. 2023. The impact of health and education on labor force participation in aging societies: Projections for the United States and Germany from dynamic microsimulations. Population Research and Policy Review, 42(3), pp. 39.
Boisclair, D., Decarie, Y., Laliberté-Auger, F., Michaud, P.C., Vincent, C. 2018. The economic benefits of reducing cardiovascular disease mortality in Quebec, Canada. PLOS ONE, 13(1), e0190538.
Boneva, Y. 2018. Optimization of car traffic flow on intersections regulated by traffic lights through the simulation environment Aimsun. Mechanics Transport Communications – Academic Journal, 1663(2018/2).
Bonnet, C., Juin, S., Laferrère, A. 2019. Private financing of long-term care: Income, savings and reverse mortgages. Économie et Statistique, 507(1), pp. 5–24.
Boyer, M., De Donder, P., Fluet, C., Leroux, M.L., Michaud, P.C. 2017. Long-term care insurance: Knowledge barriers, risk perception and adverse selection. NBER Working Paper, No. w23918.
Burgard, J.P., Schmaus, S. 2019. Sensitivity analysis for dynamic microsimulation models. Research Papers in Economics, No. 15/19.
Burgard, J.P., Dieckmann, H., Krause, J., Merkle, H., Münnich, R., Neufang, K.M., Schmaus, S. 2020. A generic business process model for conducting microsimulation studies. Statistics in Transition New Series, 21(4), pp. 191–211.
Burgard, J.P., Krause, J., Merkle, H., Münnich, R., Schmaus, S. 2019. Conducting a dynamic microsimulation for care research: Data generation, transition probabilities and sensitivity analysis. Workshop on Stochastic Models, Statistics and Their Application. Springer, Cham, pp. 269–290.
Burka, D., Mohácsi, L., Csicsman, J., Soos, B. 2017. Supporting pension pre-calculation with dynamic microsimulation technologies. ECMS Conference, pp. 562–568.
Calcagno, L.E. 2017. Does the introduction of non-contributory social benefits discourage registered labour? Testing the impact of pension moratoriums on unregistered employment in Argentina (2003–2015). Unpublished Manuscript.
Cheng, W.H., Gaudette, É., Goldman, D.P. 2017. PCSK9 inhibitors show value for patients and the US health care system. Value in Health, 20(10), pp. 1270–1278.
Chhatwal, J., Chen, Q. 2019. An optimization tool for global hepatitis C elimination: A case for hepatitis C elimination in China. Hepatology, 70(S1).
Chingcuanco, F., Miller, E.J. 2018. The ILUTE demographic microsimulation model for the Greater Toronto–Hamilton Area: Current operational status and historical validation. Geocomputational Analysis and Modeling of Regional Systems. Springer, Cham, pp. 167–187.
Christl, M., Bélanger, A., Conte, A., Mazza, J., Narazani, E. 2022. Projecting the fiscal impact of immigration in the European Union. Fiscal Studies, 43(4), pp. 365–385.
Chrysanthopoulou, S.A., Rutter, C.M., Gatsonis, C.A. 2021. Bayesian versus empirical calibration of microsimulation models: A comparative analysis. Medical Decision Making, Article ID: 0272989X211009161.
Collins, B., Kypridemos, C., Pearson-Stuttard, J., Huang, Y., Bandosz, P., Wilde, P., Kersh, R., Capewell, S., Mozzafarian, D., Whitsel, L. and Micha, R., 2018. Cost-effectiveness of the FDA sodium reduction targets for the processed food industry: are there internal incentives to reformulate?. Circulation, 137(suppl_1), pp.A019-A019.
Conti, G. 2019. Estimating the lifetime benefits of childhood obesity interventions: A dynamic microsimulation model. 2019 World Congress on Health Economics, iHEA.
Conti, R., Bavaro, M., Boscolo, S., Fabrizi, E., Puccioni, C., Ricchi, O., Tedeschi, S. 2023. The Italian Treasury Dynamic Microsimulation Model (T-DYMM): data, structure and baseline results. Ministry of Economy and Finance, Department of the Treasury Working Paper, (1).
Cosic, D., Johnson, R.W. 2020. How much does work pay at older ages? In: Current and Emerging Trends in Aging and Work. Springer, Cham, pp. 141–162.
Courtioux, P., Lignon, V. 2017. Breakdown of private returns to higher education: A dynamic microsimulation analysis of the French tax-benefit system. Économie Prévision, (1), pp. 69–94.
Craig, P., Barr, B., Baxter, A.J., Brown, H., Cheetham, M., Gibson, M., Katikireddi, S.V., Moffatt, S., Morris, S., Munford, L.A., Richiardi, M. 2022. Evaluation of the mental health impacts of Universal Credit: protocol for a mixed methods study. BMJ open, 12(4), p.e061340.
Danková, D., Halásková, R., Šebo, J. 2022. Fiscal and redistributive impacts of the introduction of dynamic components in maternity benefits. Equilibrium. Quarterly Journal of Economics and Economic Policy, 17(1), pp. 103–131.
Davis, P., Lay-Yee, R. 2019. SociaLab: A dynamic microsimulation model. Simulating Societal Change. Springer, Cham, pp. 21–31.
de Oliveira, C., Matias, M.A., Jacobs, R. 2023. Microsimulation models on mental health: A critical review of the literature. Value in Health.
Degers, G., Van den Bosch, G.D.K. 2018. Prospective microsimulation of pensions in European Member States. Applications of Microsimulation Modelling, 13.
Dekkers, G. 2017. Dynamic microsimulation: What is it (used for in Europe)? Unpublished Manuscript.
Dekkers, G., Desmet, R., Van den Bosch, K. 2023. Risques de pauvreté et inégalités de revenus à l’horizon 2070: Projections du modèle de microsimulation dynamique révisé MIDAS 2.0. Federal Planning Bureau, Belgium, Working Paper 03-23.
Dekkers, G., Tarantchenko, E., Van den Bosch, K. 2019. Medium-term projection for Belgium of the at-risk-of-poverty and social exclusion indicators based on EU-SILC. Federal Planning Bureau, Belgium, Working Paper 03-19.
Dekkers, G., Van den Bosch, K., Barslund, M., Kirn, T., Baumann, N., Kump, N., Liégeois, P., Moreira, A., Stropnik, N. 2022. How do gendered labour market trends and the pay gap translate into the projected gender pension gap? A comparative analysis of five countries with low, middle and high GPGs. Social Sciences, 11(7), p.304.
Drabo, E.F., Moucheraud, C., Nguyen, A., Garland, W.H., Holloway, I.W., Leibowitz, A., Suen, S.C. 2022. Using microsimulation modeling to inform EHE implementation strategies in Los Angeles County. JAIDS Journal of Acquired Immune Deficiency Syndromes, 90(1), pp. S167–S176.
Ernst, J., Dräger, S., Schmaus, S., Weymeirsch, J., Alsaloum, A., Münnich, R. 2023. The influence of migration patterns on regional demographic development in Germany. Social Sciences, 12(5), pp. 255.
Fischer, B., Hügle, D. 2020. The private and fiscal returns to higher education: A simulation approach for a young German cohort. Diskussionsbeiträge, 2020/21.
Fraher, E., Knapton, A., McCartha, E., Leslie, L.K. 2024. Forecasting the future supply of pediatric subspecialists in the United States: 2020–2040. Pediatrics, 153(Supplement 2).
Fredriksen, D., Holmøy, E., Strøm, B., Stølen, N.M. 2019. Fiscal effects of the Norwegian pension reform: A micro–macro assessment. Journal of Pension Economics and Finance, 18(1), pp. 88–123.
Galiana, L., Wilner, L. 2023. Private wealth over the life-cycle: A meeting between microsimulation and structural approaches. Insee – Institut national de la statistique et des études économiques.
Garibay, M.G. 2023. The retirement decision in dynamic microsimulation models: An exploratory review. International Journal of Microsimulation, 16(3), pp. 19–48.
Genevois, A.-S., Liegois, P., Noel, P.A.M. 2019. DyMH_LU: a simple tool for modelling and simulating the health status of the Luxembourgish elderly in the longer run. LISER, Working Paper No. 2019-06.
Gómez-Marín, C.G., Mosquera-Tobón, J.D., Serna-Urán, C.A. 2022. Microsimulation calibration integrating synthetic population generation and complex interaction clusters to evaluate COVID-19 spread. Handbook on Decision Making: Volume 3: Trends and Challenges in Intelligent Decision Support Systems. Springer, Cham, pp. 419–437.
Gómez-Marín, C.G., Mosquera-Tobón, J.D., Serna-Urán, C.A. 2023. Integrating multi-agent system and microsimulation for dynamic modeling of urban freight transport. Periodica Polytechnica Transportation Engineering, 51(4), pp. 409–416.
Gong, C.L., Zhao, H., Wei, Y., Tysinger, B., Goldman, D.P., Williams, R.G. 2020. Lifetime burden of adult congenital heart disease in the USA using a microsimulation model. Pediatric Cardiology, 41(7), pp. 1515–1525.
Hamdy, M.S., Yusuf, M.M. 2017. A review on long-term care expenditure models for aging population. Advanced Science Letters, 23(5), pp. 4977–4980.
Handels, R.L., Green, C., Gustavsson, A., Herring, W.L., Winblad, B., Wimo, A., Sköldunger, A., Karlsson, A., Anderson, R., Belger, M., Brück, C. 2023. Cost‐effectiveness models for Alzheimer's disease and related dementias: iPECAD modeling workshop cross‐comparison challenge. Alzheimer's & Dementia, 19(5), pp.1800-1820.
Harmon, A., Miller, E.J. 2018. Overview of a labour market microsimulation model. Procedia Computer Science, 130, pp. 172–179.
Hatfield, L.A., Favreault, M.M., McGuire, T.G., Chernew, M.E. 2018. Modeling health care spending growth of older adults. Health Services Research, 53(1), pp. 138–155.
Hennessy, D., Garner, R., Flanagan, W.M., Wall, R., Nadeau, C. 2017. Development of a population-based microsimulation model of body mass index. Health Reports, 28(6), pp. 20–30. Statistics Canada, Catalogue no. 82-003-X.
Herman, P.M., Chen, A.Y.A., Sturm, R. 2022. Improving diet quality in US adults: A 30-year health and economic impact microsimulation. American Journal of Preventive Medicine, 63(2), pp. 178–185.
Herman, P.M., Nguyen, P., Sturm, R. 2022. Diet quality improvement and 30-year population health and economic outcomes: A microsimulation study. Public Health Nutrition, 25(5), pp. 1265–1273.
Horvath, G.T., Spielauer, M., Fink, M. 2020. Microsimulation projection of the educational integration and labour force participation of first- and second-generation immigrants. WIFO Working Papers, No. 615.
Horvath, T., Leoni, T., Reschenhofer, P., Spielauer, M. 2023. Socio-economic inequality and healthcare costs over the life course – A dynamic microsimulation approach. Public Health, 219, pp. 124–130.
Huber, P., Spielauer, M. 2020. Return and onward migration and labour market entry: Empirical analysis and microsimulation projection for Austria. WIFO Working Papers, No. 616.
Hügle, D. 2021. The decision to enrol in higher education. Diskussionsbeiträge, No. 2021/8.
Inagaki, S. 2018. Dynamic microsimulation model of impoverishment among elderly women in Japan. Frontiers in Physics, 6, pp. 22.
Jaddoe, V.W., Felix, J.F., Andersen, A.M.N., Charles, M.A., Chatzi, L., Corpeleijn, E., Donner, N., Elhakeem, A., Eriksson, J.G., Foong, R., Grote, V. 2020. The LifeCycle Project-EU Child Cohort Network: a federated analysis infrastructure and harmonized data of more than 250,000 children and parents. European journal of epidemiology, 35, pp.709-724.
Jia, Z., Leknes, S., Løkken, S.A. 2023. Moving beyond expectations: From cohort-component to microsimulation projections. Unpublished Manuscript.
Johnson, R.W. 2017. Assessing policy options to address wealth and health inequality at older ages. Innovation in Aging, 1(Suppl_1), pp. 1004.
Johnson, R.W., Smith, K.E., Butrica, B.A. 2023. Lifetime employment-related costs to women of providing family care. Urban Institute Report, Washington, DC.
Johnson, R.W., Smith, K.E., Cosic, D., Wang, C.X. 2017. Retirement prospects for the Millennials: What is the early prognosis? CRR Working Paper, 17.
Jones, K., Munoz, B., Rineer, J., Bobashev, G., Hilscher, R., Rhea, S. 2019. On calibrating a microsimulation of patient movement through a healthcare network. 2019 Winter Simulation Conference (WSC). IEEE, pp. 205–214.
Jung, Y.S., Kim, Y.E., Go, D.S., Yoon, S.J. 2020. Projecting the prevalence of obesity in South Korea through 2040: A microsimulation modelling approach. BMJ Open, 10(12), e037629.
Kajiwara, K., Ma, J., Seto, T., Sekimoto, Y., Ogawa, Y., Omata, H. 2022. Development of current estimated household data and agent-based simulation of the future population distribution of households in Japan. Computers, Environment and Urban Systems, 98, 101873.
Kasajima, M., Eggleston, K., Kusaka, S., Matsui, H., Tanaka, T., Son, B.K., Iijima, K., Goda, K., Kitsuregawa, M., Bhattacharya, J., Hashimoto, H. 2022. Projecting prevalence of frailty and dementia and the economic cost of care in Japan from 2016 to 2043: a microsimulation modelling study. The Lancet Public Health, 7(5), pp.e458-e468.
Kim, D. 2021. Applications of microsimulation models to the social determinants of health and public health. New Horizons in Modeling and Simulation for Social Epidemiology and Public Health.
Kingston, A., Jagger, C. 2018. How will dependency-free life expectancy in England evolve over the next twenty years for men and women? Innovation in Aging, 2(Suppl_1), pp. 14.
Kingston, A., Jagger, C. 2019. What is the effect of reducing obesity on later-life dependency? Findings from the PACSim model. Innovation in Aging, 3(Suppl_1), pp. S49.
Kingston, A., Comas-Herrera, A., Jagger, C. 2018. Forecasting the care needs of the older population in England over the next 20 years: Estimates from the Population Ageing and Care Simulation (PACSim) modelling study. The Lancet Public Health, 3(9), pp. e447–e455.
Kingston, A., Robinson, L., Booth, H., Knapp, M., Jagger, C., MODEM project. 2018. Projections of multi-morbidity in the older population in England to 2035: Estimates from the Population Ageing and Care Simulation (PACSim) model. Age and Ageing, 47(3), pp. 374–380.
Kingston, A., Wittenberg, R., Hu, B., Jagger, C. 2022. Projections of dependency and associated social care expenditure for the older population in England to 2038: Effect of varying disability progression. Age and Ageing, 51(7), afac158.
Kirn, T., Dekkers, G. 2023. The projected development of the gender pension gap in Switzerland: Introducing MIDAS_CH. International Journal of Microsimulation, 16(3), pp. 100–129.
Laditka, J.N., Laditka, S.B. 2018. Work disability in the United States, 1968–2015: Prevalence, duration, recovery, and trends. SSM – Population Health, 4, pp. 126–134.
Laditka, S.B., Laditka, J.N., Gunn, L. 2019. Association of attitudes with economic well-being and health: A foundation for public policy. Innovation in Aging, 3(Suppl 1), pp. S125–S125.
Legendre, F. 2019. The emergence and consolidation of microsimulation methods in France. Économie et Statistique, 510(1), pp. 201–217.
Levell, P., Roantree, B., Shaw, J. 2020. Mobility and the lifetime distributional impact of tax and transfer reforms. International Tax and Public Finance, pp. 1–43.
Li, B., Zhang, S., Hoover, S., Arnold, R., Capan, M. 2018. Microsimulation model using Christiana Care Early Warning System (CEWS) to evaluate physiological deterioration. IEEE Journal of Biomedical and Health Informatics, 23(5), pp. 2189–2195.
Linas, B. 2020. Review 3: College campuses and COVID-19 mitigation: Clinical and economic value. Rapid Reviews COVID-19.
Lomax, N.M., Smith, A.P. 2017. Microsimulation for demography. Australian Population Studies, 1(1), pp. 73–85.
Losina, E., Leifer, V., Millham, L., Panella, C., Hyle, E.P., Mohareb, A.M., Neilan, A.M., Ciaranello, A.L., Kazemian, P., Freedberg, K.A. 2021. College campuses and COVID-19 mitigation: clinical and economic value. Annals of internal medicine, 174(4), pp.472-483.
Luong Nguyen, L.B., Freedberg, K.A., Wanjala, S., Maman, D., Szumilin, E., Mendiharat, P., Yazdanpanah, Y. 2020. Comparative effectiveness of interventions to improve the HIV continuum of care and HIV preexposure prophylaxis in Kenya: A model-based analysis. The Journal of Infectious Diseases.
Luong Nguyen, L.B., Yazdanpanah, Y., Maman, D., Wanjala, S., Vandenbulcke, A., Price, J., Parker, R.A., Hennequin, W., Mendiharat, P., Freedberg, K.A. 2018. Voluntary community human immunodeficiency virus testing, linkage, and retention in care interventions in Kenya: modeling the clinical impact and cost-effectiveness. Clinical Infectious Diseases, 67(5), pp.719-726.
MacDonald, B.J. 2019. New Canada Pension Plan enhancements: What will they mean for Canadian seniors? Canadian Public Policy, 45(4), pp. 403–427.
Maldonado, N., Camacho, S.M., Cueto, E., Arango-Bautista, C.H. 2019. Fat to the future: A dynamic microsimulation model to evaluate the long-run health and economic effects of obesity policies. 2019 World Congress on Health Economics, iHEA.
Malleson, N., Birkin, M., Birks, D., Ge, J., Heppenstall, A., Manley, E., McCulloch, J., Ternes, P. 2022. Agent-based modelling for Urban Analytics: State of the art and challenges. AI Communications, 35(4), pp.393-406.
Mallet, L., Weale, M. 2018. Nowcasting household median income: A comparison of microsimulation and time series approaches. 35th IARIW General Conference, Copenhagen.
Mansfield, T.J., Gibson, J.M. 2017. A novel dynamic microsimulation model to explore competing transportation health risks. Transportation Research Board Paper, No. 17-02610.
Manso, L.P.D.O.G. 2018. The reform of the Portuguese pension system: A micro-simulation approach. PhD Thesis.
Marcelo, N., Rozane, S., José, N., Manuel, O. 2018. Fiscal redistribution in Brazil: Dynamic microsimulation, 2003–15. World Institute for Development Economic Research (UNU-WIDER), Working Paper No. 136.
Marois, G., Aktas, A. 2021. Projecting health-ageing trajectories in Europe using a dynamic microsimulation model. Scientific Reports, 11(1), pp. 1–15.
May, P., Normand, C., Matthews, S., Kenny, R.A., Romero-Ortuno, R., Tysinger, B. 2022. Projecting future health and service use among older people in Ireland: An overview of a dynamic microsimulation model in The Irish Longitudinal Study on Ageing (TILDA). HRB Open Research, 5.
Mielczarek, B. 2022. A simulation study of the delayed effect of COVID-19 pandemic on pensions and welfare of the elderly: Evidence from Poland. International Conference on Computational Science, Springer, Cham, pp. 326–340.
Mitchell, O.S., Sabelhaus, J., Utkus, S. (Eds.) 2024. Real-World Shocks and Retirement System Resiliency. Oxford University Press.
Montaud, J.M., Pecastaing, N., Tankari, M. 2017. Potential socio-economic implications of future climate change and variability for Nigerien agriculture: A countrywide dynamic CGE-microsimulation analysis. Economic Modelling, 63, pp. 128–142.
Moore, K.D., Hicks, C., Jones, J., Spielauer, M. 2017. The DYSEM microsimulation modelling platform. Statistique Canada.
Mortari, A.P., Atella, V., Belotti, F. 2020. PDB39 assessing the impact of new anti-diabetics drugs: A dynamic microsimulation approach. Value in Health, 23, pp. S512.
Mortari, P.A., Atella, V., Belotti, F. 2020. Assessing the impact of new anti-diabetics drugs: A dynamic microsimulation approach. Value in Health, 23, pp. S511–S511. Elsevier Science Inc.
Münnich, R., Schnell, R., Brenzel, H., Dieckmann, H., Dräger, S., Emmenegger, J., Höcker, P., Kopp, J., Merkle, H., Neufang, K., Obersneider, M. 2021. A population based regional dynamic microsimulation of Germany: the MikroSim model. Methods, data, analyses: a journal for quantitative methods and survey methodology (mda), 15(2), pp.241-264.
Neri, M.C., de Siqueira, R.B., Nogueira, J.R.B., Osorio, M. 2018. Fiscal redistribution in Brazil: Dynamic microsimulation, 2003–15. WIDER Working Paper, No. 2018/136.
Nguyen, L.B.L., Freedberg, K.A., Wanjala, S., Maman, D., Szumilin, E., Mendiharat, P., Yazdanpanah, Y. Comparative effectiveness of interventions to improve the HIV continuum of care and HIV pre-exposure prophylaxis in Kenya: A model-based analysis. The Journal of Infectious Diseases, 225(6), pp.1032-1039.
Nicola, R. 2023. Portuguese pensions in the balance: Public policy options on adequacy and financial sustainability using dynamic microsimulation modelling. Doctoral dissertation, University of Southampton.
Nilson, E.A.F., Pearson-Stuttard, J., Collins, B., Guzman-Castillo, M., Capewell, S., O’Flaherty, M., Jaime, P.C., Kypridemos, C. 2020. OP32 Quantifying the health and economic benefits of the Brazilian voluntary salt reformulation targets: an IMPACTNCD BR microsimulation.
Njoya, E.T., Seetaram, N. 2018. Tourism contribution to poverty alleviation in Kenya: A dynamic computable general equilibrium analysis. Journal of Travel Research, 57(4), pp. 513–524.
O’Donoghue, C. 2017. Farm-level income generation microsimulation model. Farm-Level Microsimulation Modelling. Palgrave Macmillan, Cham, pp. 177–214.
O’Donoghue, C., Sologon, D.M., Kyzyma, I. 2023. Novel welfare state responses in times of crises: The COVID-19 crisis versus the Great Recession. Socio-Economic Review, 21(1), pp. 501–531.
O’Donoghue, C., Dekkers, G. 2018. Increasing the impact of dynamic microsimulation modelling. International Journal of Microsimulation, 11(1), pp. 61–96.
O’Donoghue, C., Leach, R.H., Hynes, S. 2017. Simulating earnings in dynamic microsimulation models. New Frontiers in Microsimulation Modelling. Routledge, pp. 381–412.
O’Donoghue, C., Sologon, D.M., Kyzyma, I., McHale, J. 2020. Modelling the distributional impact of the COVID-19 crisis. Fiscal Studies, 41(2), pp. 321–336.
Pappas, M.A., Vijan, S., Rothberg, M.B., Singer, D.E. 2018. Reducing age bias in decision analyses of anticoagulation for patients with nonvalvular atrial fibrillation – A microsimulation study. PLOS ONE, 13(7), e0199593.
Patwary, A.U.Z., Huang, W., Lo, H.K. 2017. Calibration of a regional activity-based dynamic microsimulation model: A case study on Hong Kong Island. Transport and Society – Proceedings of the 22nd International Conference of Hong Kong Society for Transportation Studies, HKSTS 2017, pp. 173.
Patxot, C., Solé Juvés, M., Souto Nieves, G., Spielauer, M. 2018. The impact of the retirement decision and demographics on pension sustainability: A dynamic microsimulation analysis. International Journal of Microsimulation, 11(2), pp. 84–108.
Petreski, B., Gacov, P. 2018. Sustainability of the pension system in Macedonia: A comprehensive analysis and reform proposal with MK-PENS dynamic microsimulation model. Finance Think Policy Studies, 2018-02/14.
Petreski, B., Petreski, M. 2021. Dynamic microsimulation modelling of potential pension reforms in North Macedonia. Journal of Pension Economics & Finance, 20(1), pp. 49–66.
Probst, C., Buckley, C., Lasserre, A.M., Kerr, W.C., Mulia, N., Puka, K., Purshouse, R.C., Ye, Y., Rehm, J. 2023. Simulation of Alcohol Control Policies for Health Equity (SIMAH) project: study design and first results. American journal of epidemiology, 192(5), pp.690-702.
Puga-Gonzalez, I., Bacon, R.J., Voas, D., Shults, F.L., Hodulik, G., Wildman, W.J. 2022. Adapting cohort-component methods to a microsimulation: A case study. Social Science Computer Review, 40(4), pp. 1054–1068.
Rasella, D., Richiardi, L., Brachowicz, N., Jara, H.X., Hanson, M., Boccia, D., Richiardi, M.G., Pizzi, C. 2021. Developing an integrated microsimulation model for the impact of fiscal policies on child health in Europe: the example of childhood obesity in Italy. BMC medicine, 19, pp.1-12.
Reddy, K.P., Shebl, F.M., Foote, J.H., Harling, G., Scott, J.A., Panella, C., Fitzmaurice, K.P., Flanagan, C., Hyle, E.P., Neilan, A.M., Mohareb, A.M. 2021. Cost-effectiveness of public health strategies for COVID-19 epidemic control in South Africa: a microsimulation modelling study. The Lancet Global Health, 9(2), pp.120-129.
Ricchi, O. 2019. The Treasury Dynamic Microsimulation Model (T-DYMM). Unpublished Manuscript.
Richardson, R., Pacelli, L., Poggi, A., Richiardi, M. 2018. Female labour force projections using microsimulation for six EU countries. International Journal of Microsimulation, 11(2), pp. 5–83.
Richiardi, M.G., Richardson, R.E. 2017. JAS-mine: A new platform for microsimulation and agent-based modelling. International Journal of Microsimulation, 10(1), pp. 106–134.
Richiardi, M., Bronka, P. 2022. LABSim: A dynamic life course model of individual life course trajectories for Italy. CEMPA Working Paper, No. 5/22. Centre for Microsimulation and Policy Analysis, ISER.
Richiardi, M., Richardson, R.E. 2017. Agent-based computational demography and microsimulation using JAS-mine. Agent-Based Modelling in Population Studies. Springer, Cham, pp. 75–112.
Richiardi, M., Pacelli, L., Poggi, A., Richardson, R. 2017. Female labour force projections using microsimulation for six EU countries. Unpublished Manuscript.
Roantree, B. 2019. Essays in Public Economics. Doctoral dissertation, UCL (University College London).
Ross, R., Pacelli, L., Poggi, A., Richiardi, M.G. 2018. Female labour force projections using microsimulation for six EU countries. International Journal of Microsimulation, 11(2), pp. 5–51.
Ryan, M. Economics of Forestry Planting in Ireland. PhD dissertation, NUI Galway.
Ryan, M., O’Donoghue, C. 2017. Inter-temporal microsimulation model: Forestry planting decisions. Farm-Level Microsimulation Modelling. Palgrave Macmillan, Cham, pp. 241–282.
Sabelhaus, J., Volz, A.H. 2022. Wealth inequality and retirement preparedness: A cross-cohort perspective. Wharton Pension Research Council Working Paper, No. 21.
Salonen, J. 2020. New methods in pension evaluation: Applications of trajectory analysis and dynamic microsimulation. Finnish Centre for Pensions.
Salonen, J., Möttönen, J., Tikanmäki, H., Nummi, T. 2020. Using sequence analysis to visualize and validate model transitions. International Journal of Microsimulation.
Salonen, J., Tikanmäki, H., Nummi, T. 2019. Using trajectory analysis to test and illustrate microsimulation outcomes. International Journal of Microsimulation, 12(2).
Schnell, R., Weiand, S. 2023. Microsimulation of an educational attainment register to predict future record linkage quality. International Journal of Population Data Science, 8(1).
Schofield, D., Zeppel, M.J., Tan, O., Lymer, S., Cunich, M.M., Shrestha, R.N. 2018. A brief, global history of microsimulation models in health: Past applications, lessons learned and future directions. International Journal of Microsimulation, 11(1), pp. 97–142.
Schofield, D., Zeppel, M.J., Tanton, R., Veerman, J.L., Kelly, S.J., Passey, M.E., Shrestha, R.N. 2022. Individual and national financial impacts of informal caring for people with mental illness in Australia, projected to 2030. BJPsych Open, 8(4), e136.
Seabury, S.A., Axeen, S., Pauley, G., Tysinger, B., Schlosser, D., Hernandez, J.B., Heun-Johnson, H., Zhao, H., Goldman, D.P. 2019. Measuring the lifetime costs of serious mental illness and the mitigating effects of educational attainment. Health Affairs, 38(4), pp.652-659.
Shackleton, N., Chang, K., Lay-Yee, R., D’Souza, S., Davis, P., Milne, B. 2019. Microsimulation model of child and adolescent overweight: Making use of what we already know. International Journal of Obesity, 43(11), pp. 2322–2332.
Shewmaker, P., Chrysanthopoulou, S.A., Iskandar, R., Lake, D., Jutkowitz, E. 2022. Microsimulation model calibration with approximate Bayesian computation in R: A tutorial. Medical Decision Making, 42(5), pp. 557–570.
Shrestha, R.N., Schofield, D., Zeppel, M.J., Cunich, M.M., Tanton, R., Kelly, S.J., Veerman, L., Passey, M.E. 2018. Care & WorkMOD: An Australian microsimulation model projecting the economic impacts of early retirement in informal carers. International Journal of Microsimulation, 11(3), pp.78-99.
Siripanich, A., Rashidi, T. 2020. A demographic microsimulation model with an integrated household alignment method. arXiv preprint, arXiv:2006.09474.
Siripanich, A., Rashidi, T.H. 2020. Dymium: A modular microsimulation modelling framework for integrated urban modelling. SoftwareX, 12, 100555.
Skarda, I., Asaria, M., Cookson, R. 2021. LifeSim: A lifecourse dynamic microsimulation model of the Millennium Birth Cohort in England. medRxiv.
Skarda, I., Asaria, M., Cookson, R. 2022. Evaluating childhood policy impacts on lifetime health, wellbeing and inequality: Lifecourse distributional economic evaluation. Social Science & Medicine, 302, 114960.
Smith, D.M., Heppenstall, A., Campbell, M. 2021. Estimating health over space and time: A review of spatial microsimulation applied to public health. J, 4(2), pp. 182–192.
Smith, K., Johnson, R.W. 2022. How gloomy is the retirement outlook for Millennials? Wharton Pension Research Council Working Paper, 2022-22.
Sologon, D.M., O’Donoghue, C., Kyzyma, I., Li, J., Linden, J., Wagener, R. 2022. The COVID-19 resilience of a continental welfare regime – Nowcasting the distributional impact of the crisis. The Journal of Economic Inequality, 20(4), pp. 777–809.
Sorensen, R.J., Flaxman, A.D., Deason, A., Mumford, J.E., Eldrenkamp, E., Moses, M., Weaver, M.R. 2017. Microsimulation models for cost-effectiveness analysis: A review and introduction to CEAM. Proceedings of the Summer Simulation Multi-Conference, pp. 1–11.
Spielauer, M., Dupriez, O. 2017. Dynamic microsimulation for population projections in developing countries: A portable application with a country case study (DYNAMIS-POP-MRT). Unpublished Report.
Spielauer, M., Dupriez, O. 2019. A portable dynamic microsimulation model for population, education and health applications in developing countries. International Journal of Microsimulation, 12(3), pp. 6–27.
Spielauer, M., Horvath, G.T., Fink, M. 2020. microWELT: A dynamic microsimulation model for the study of welfare transfer flows in ageing societies from a comparative welfare state perspective. WIFO Working Papers, No. 609.
Spielauer, M., Horvath, G.T., Fink, M., Abio, G., Souto, G., Patxot, C., Istenič, T. 2020. microWELT: Microsimulation projection of full generational accounts for Austria and Spain. WIFO Working Papers, No. 618.
Spielauer, M., Horvath, G.T., Fink, M., Abio, G., Souto, G., Patxot, C., Istenic, T. 2020. microWELT: Microsimulation projection of indicators of the economic effects of population ageing based on disaggregated national transfer accounts. WIFO Working Papers, No. 612.
Spielauer, M., Horvath, G.T., Hyll, W., Fink, M. 2020. microWELT: Socio-demographic parameters and projections for Austria, Spain, Finland and the UK. WIFO Working Papers, No. 611.
Spielauer, M., Horvath, T., Fink, M., Abio, G., Patxot, C., Souto, G., Istenič, T. 2020. microWELT – Microsimulation projection of full generational accounts from a comparative welfare state perspective: Results for Spain, Austria, Finland and the UK. Unpublished Working Paper.
Spielauer, M., Horvath, T., Fink, M., Abio, G., Souto, G., Patxot, C., Istenič, T. 2022. Measuring the lifecycle impact of welfare state policies in the face of ageing. Economic Analysis and Policy, 75, pp. 1–25.
Spielauer, M., Horvath, T., Fink, M., Abio, G., Souto, G., Patxot, C., Istenič, T. 2023. The effect of educational expansion and family change on the sustainability of public and private transfers. The Journal of the Economics of Ageing, 25, 100455.
Spielauer, M., Solé, M., Horvath, T., Fink, M., Patxot, C., Souto, G. 2019. Microsimulation of disaggregated national transfer accounts (NTAs) for the comparative study of welfare state regimes. Paper presented at the 2019 World Conference of the International Microsimulation Association.
Spijker, J., Devolder, D., Zueras, P. 2020. The impact of demographic change on the balance between formal and informal old-age care in Spain: Results from a mixed microsimulation–agent-based model. Ageing & Society, pp. 1–26.
Spijker, J., Devolder, D., Zueras, P. 2022. The impact of demographic change on the balance between formal and informal old-age care in Spain. Ageing & Society, 42(3), pp. 588–613.
Štefánik, M., Miklošovič, T. 2020. Modelling foreign labour inflows using a dynamic microsimulation model of an ageing country – Slovakia. International Journal of Microsimulation, 13(2), pp. 102–113.
Stølen, N.M., Fredriksen, D., Hernæs, E., Holmøy, E. 2019. The Norwegian NDC scheme. Unpublished Report.
Stølen, N.M., Fredriksen, D., Hernæs, E., Holmøy, E. 2019. The Norwegian NDC scheme: Balancing risk sharing and redistribution. World Bank.
Tamborini, C.R., Reznik, G.L., Iams, H.M., Couch, K.A. 2022. The growing socioeconomic gap in lifetime Social Security retirement benefits: Current and future retirees. The Journals of Gerontology: Series B, 77(4), pp. 803–814.
Tanton, R., Vidyattama, Y. 2020. Using spatial microsimulation to derive a base file for a spatial decision support system. Population Change and Impacts in Asia and the Pacific. Springer, Singapore, pp. 107–120.
Tchoffo, R.N., Ngouhouo, I. 2020. Cameroon’s bilateral economic partnership agreement: A microsimulation approach. Applied Economics and Finance, 7(2), pp. 67–84.
Tikanmäki, H., Lappo, S. 2020. ELSI: The Finnish pension microsimulation model. Finnish Centre for Pensions.
Tomintz, M.N., Kosar, B., García-Barrios, V.M. 2017. simSALUD: Design and implementation of an open-source wizard-based spatial microsimulation framework. International Journal of Microsimulation, 10(2), pp. 118–143.
Tóth, K. 2020. Simulating the long-term labour market effects of economic transition in Hungary: The MIDAS_HU microsimulation model. International Journal of Microsimulation Modelling, pp. 153.
Tysinger, B., Goldman, D. n.d. The long-term fiscal benefits (and costs) of better disease prevention. Working Paper.
van de Ven, J.W. 2017. Parameterising a detailed dynamic programming model of savings and labour supply using cross-sectional data. International Journal of Microsimulation, 10(1), pp. 135–166.
Verbist, G., Philips, H. 2021. Concepts and methods for microsimulation modeling in the social sciences. New Horizons in Modeling and Simulation for Social Epidemiology and Public Health.
Waizman, G., Shoval, S., Benenson, I. 2018. Traffic accident risk assessment with dynamic microsimulation model using range–range rate graphs. Accident Analysis & Prevention, 119, pp. 248–262.
Wei, Y., Heun-Johnson, H., Tysinger, B. 2022. Using dynamic microsimulation to project cognitive function in the elderly population. PLOS ONE, 17(9), e0274417.
Wheeler, S.B., Rotter, J., Gogate, A., Reeder-Hayes, K.E., Drier, S.W., Ekwueme, D.U., Fairley, T.L., Rocque, G.B. Trogdon, J.G. 2023. Cost-effectiveness of pharmacologic treatment options for women with endocrine-refractory or triple-negative metastatic breast cancer. Journal of Clinical Oncology, 41(1), pp.32-42.
Wittenberg, R., Hu, B., Jagger, C., Kingston, A., Knapp, M., Comas-Herrera, A., King, D., Rehill, A., Banerjee, S. 2020. Projections of care for older people with dementia in England: 2015 to 2040. Age and Ageing, 49(2), pp.264-269.
Young, N., Bowman, A., Swedin, K., Collins, J., Blair-Stahn, N.D., Lindstedt, P.A., Troeger, C., Flaxman, A.D. 2022. Cost-effectiveness of antenatal multiple micronutrients and balanced energy protein supplementation compared to iron and folic acid supplementation in India, Pakistan, Mali, and Tanzania: A dynamic microsimulation study. PLOS Medicine, 19(2), e1003902.
Young, N., Bowman, A., Swedin, K., Collins, J.K., Troeger, C., Flaxman, A.D. 2021. Cost-Effectiveness of Multiple Micronutrients and Balanced-Energy Protein Supplementation During Antenatal Care in India, Pakistan, Mali and Tanzania: A Dynamic Microsimulation. Pakistan, Mali and Tanzania: A Dynamic Microsimulation.
Zhong, H., Aaron, A., Hiebert, L., Serumondo, J., Zhuo, Y., Adee, M., Rwibasira, G.N., Ward, J.W. Chhatwal, J. 2024. Hepatitis C elimination in Rwanda: progress, feasibility, and economic evaluation. Value in Health, 27(7), pp.918-925.
Zhou, M., Men, Y., Qing, X. 2021. Current development in microsimulation and experimental innovation method in JUTTA model. Journal of Physics: Conference Series, 1865(4), 042136. IOP Publishing.
References
- Andreassen, L, Fredriksen, D, Gjefsen, HM, Halvorsen, E, Stølen, NM (2020). The dynamic cross-sectional microsimulation model MOSART. International Journal of Microsimulation, 13, 92–113. https://doi.org/10.34196/ijm.00214
- Archer, L, Lomax, N, Tysinger, B (2021). A dynamic microsimulation model for ageing and health in england: The english future elderly model. International Journal of Microsimulation, 14, 2–26.
- Atella, V, Belotti, F, Carrino, L, Piano Mortari, A (2017). CEIS Working Paper No. 405.
- Bouffard, N, Easther, R, Johnson, T, Morrison, RJ, Vink, J (2001). Matchmaker, matchmaker, make me a match. Brazilian Electronic Journal of Economics, 4.
- Bourguignon, F, Spadaro, A (2006). Microsimulation as a tool for evaluating redistribution policies. The Journal of Economic Inequality, 4, 77–106. https://doi.org/10.1007/s10888-005-9012-6
- Calcagno, LE (2017). Does the introduction of non-contributory social benefits discourage registered labour? Testing the impact of pension moratoriums on unregistered employment in Argentina.
- Caldwell, S, Favreault, M, Gantman, A, Gokhale, J, Johnson, T, Kotlikoff, LJ (1999). Social Security’s Treatment of Postwar Americans. Tax Policy and the Economy, 13, 109–148. https://doi.org/10.1086/tpe.13.20061869
- Caldwell, S, Morrison, R (2000). Microsimulation in the New Millennium.
- Cassells, R, Harding, A, Kelly, S (2006). Problems and Prospects for Dynamic Microsimulation: A Review and Lessons for APPSIM. NATSEM, University of Canberra.
- Dekkers, G, Bosch, Van den, K, Barslund, M, Kirn, T, Baumann, N, Kump, N, Stropnik, N (2022). How do gendered labour market trends and the pay gap translate into the projected gender pension gap? A comparative analysis of five countries with low, middle and high GPGs. Social Sciences, 11.
- De Menten, G, Dekkers, G, Bryon, G, Liégeois, P, O’Donoghue, C (2014). LIAM2: a New Open Source Development Tool for Discrete-Time Dynamic Microsimulation Models. Journal of Artificial Societies and Social Simulation, 17. https://doi.org/10.18564/jasss.2574
- de Oliveira, C, Matias, MA, Jacobs, R (2023). Microsimulation Models on Mental Health: A Critical Review of the Literature. Value in Health.
- Fischer, B, Hügle, D (2020). The Private and Fiscal Returns Tohigher Education: A Simulation Approach for A Young German Cohort, Discussion Paper, No.2020/21, Freie Universität. Berlin: School of Business & Economics.
- Galler, HP (1997). Discrete-Time and Continuous-Time Approaches to Dynamic Microsimulation Reconsidered. Canberra, Australia: National Centre for Social and Economic Modelling.
- Garibay, MG (2023). The Retirement Decision in Dynamic Microsimulation Models: An Exploratory Review. International Journal of Microsimulation, 16, 19–48. https://doi.org/10.34196/IJM.00287
- (2017). An Introduction to Systematic Reviews. Sage.
- Hägerstrand, T (1957). Lund Studies in Geography. Series B, Human GeographyN. 13.
- Harding, A (1993). Lifetime Income Distribution and Redistribution: Applications of a Microsimulation Model. Amsterdam: North Holland.
- Harding, A, Slottje, DJ (1995). Lifetime income distribution and redistribution: Applications of a microsimulation model. Journal of Economic Literature, 33, 832–833.
- Harding, A (2007). Challenges and opportunities of dynamic microsimulation modelling. .
- Harmon, A, Miller, EJ (2018). Overview of a labour market microsimulation model. Procedia Computer Science, 130, 172–179.
- Horvath, GT, Spielauer, M, Fink, M (2020). Microsimulation Projection of the Educational Integration and Labour Force Participation of First-and Second-Generation Immigrants (No.615). WIFO Working Papers.
- Kirn, T, Dekkers, G (2023). The Projected Development of the Gender Pension Gap in Switzerland: Introducing MIDAS_CH. International Journal of Microsimulation, 16, 100–129.
- Klevmarken, NA (1997). A Survey. Uppsala University, Department of Economics Working Paper Series.
- Li, J, O’Donoghue, C (2013). A survey of dynamic microsimulation models: uses, model structure and methodology. International Journal of Microsimulation, 6, 3–55.
- Li, J, O’Donoghue, C (2014). Evaluating Binary Alignment Methods in Microsimulation Models. Journal of Artificial Societies and Social Simulation, 17. https://doi.org/10.18564/jasss.2334
- Li, J., O’Donoghue, C, Dekkers, G (2014). In Handbook of Microsimulation Modelling.
- Lomax, NM, Smith, AP (2017). Microsimulation for demography. Australian Population Studies, 1, 73–85. https://doi.org/10.37970/aps.v1i1.14
- Luong Nguyen, LB, Yazdanpanah, Y, Maman, D, Wanjala, S, Vandenbulcke, A, Price, J, Freedberg, KA (2018). Voluntary community human immunodeficiency virus testing, linkage, and retention in care interventions in Kenya: modeling the clinical impact and cost-effectiveness. Clinical Infectious Diseases, 67, 719–726.
- Mannion, O, Lay-Yee, R, Wrapson, W, Davis, P, Pearson, J (2012). JAMSIM: A Microsimulation Modelling Policy Tool. Journal of Artificial Societies and Social Simulation, 15. https://doi.org/10.18564/jasss.1902
- Merz, J (1991). Microsimulation — A survey of principles, developments and applications. International Journal of Forecasting, 7, 77–104. https://doi.org/10.1016/0169-2070(91)90035-T
- Moher, D, Liberati, A, Tetzlaff, J, Altman, DG, (2009). Preferred reporting items for systematic reviews and meta-analyses: the PRISMA statement. Annals of Internal Medicine, 151, 264–269. https://doi.org/10.7326/0003-4819-151-4-200908180-00135
- Montaud, JM, Pecastaing, N, Tankari, M (2017). Potential socio-economic implications of future climate change and variability for Nigerien agriculture: A countrywide dynamic CGE-Microsimulation analysis. Economic Modelling, 63, 128–142.
- Morrison, RJ (1997). DYNACAN, the Canada pension plan policy model: Demographics and earnings components. , 18–20.
- Mortari, AP, Atella, V, Belotti, F (2020). PDB39 Assessing the IMPACT of New ANTI Diabetics Drugs: A Dynamic Microsimulation Approach. Value in Health, 23.
- Münnich, R, Schnell, R, Brenzel, H, Dieckmann, H, Dräger, S, Emmenegger, J, Stein, P (2021). A population based regional dynamic microsimulation of Germany. The Mikrosim Model. Methods, Data, Analyses, 15.
- Navicke, J, Rastrigina, O, Sutherland, H (2014). Nowcasting Indicators of Poverty Risk in the European Union: A Microsimulation Approach. Social Indicators Research, 119, 101–119. https://doi.org/10.1007/s11205-013-0491-8
- Nelissen, JHM (1993). Labour market, income formation and social security in the microsimulation model NEDYMAS. Economic Modelling, 10, 225–272. https://doi.org/10.1016/0264-9993(93)90019-C
- Nguyen, LBL, Lemoine, M, Ndow, G, Ward, ZJ, Hallet, TB, D’alessandro, U, Shimakawa, Y (2024). Treat All versus targeted strategies to select HBV-infected people for antiviral therapy in The Gambia, west Africa: a cost-effectiveness analysis. The Lancet Global Health, 12, e66–e78.
- Njoya, ET, Seetaram, N (2018). Tourism contribution to poverty alleviation in Kenya: A dynamic computable general equilibrium analysis. Journal of Travel Research, 57, 513–524.
- O’Donoghue, C (2001). Dynamic microsimulation: a methodological survey. Brazilian Electronic Journal of Economics, 4.
- O’Donoghue, C, Redway, H, Lennon, J (2010). Simulating migration in the PENSIM2 dynamic microsimulation model. International Journal of Microsimulation, 3, 65–79. https://doi.org/10.34196/ijm.00039
- O’Donoghue, C (2014). Handbook of Microsimulation Modelling. Emerald Group Publishing.
- O’Donoghue, C (2017). In Farm-Level Microsimulation Modelling.
- O’Donoghue, C, Sologon, DM, Kyzyma, I, McHale, J (2020). Modelling the Distributional Impact of the COVID-19 Crisis. Fiscal Studies, 41, 321–336. https://doi.org/10.1111/1475-5890.12231
- O’Donoghue, C (2021). Practical Microsimulation Modelling. Oxford University Press.
- Orcutt, GH (1957). A New Type of Socio-Economic System. The Review of Economics and Statistics, 39, 116–123. https://doi.org/10.2307/1928528
- Orcutt, GJ, Merz, J, Quinke, H (1986). Microanalytic Simulation Models to Support Social and Financial Policy (North Holland: Amsterdam). North Holland: Amsterdam.
- Pappas, MA, Vijan, S, Rothberg, MB, Singer, DE (2018). Reducing age bias in decision analyses of anticoagulation for patients with nonvalvular atrial fibrillation–A microsimulation study. PloS One, 13.
- Petreski, B, Petreski, M (2021). Dynamic microsimulation modelling of potential pension reforms in North Macedonia. Journal of Pension Economics & Finance, 20, 49–66.
- Rasella, D, Richiardi, L, Brachowicz, N, Jara, HX, Hanson, M, Boccia, D, Pizzi, C (2021). Developing an integrated microsimulation model for the impact of fiscal policies on child health in Europe: the example of childhood obesity in Italy. BMC Medicine, 19, 1–12.
- Reddy, KP, Shebl, FM, Foote, JH, Harling, G, Scott, JA, Panella, C, Siedner, MJ (2021). Cost-effectiveness of public health strategies for COVID-19 epidemic control in South Africa: a microsimulation modelling study. The Lancet Global Health, 9, e120–e129.
- Rephann, TJ, Holm, E (2004). Economic-Demographic Effects of Immigration: Results from a Dynamic Spatial Microsimulation Model. International Regional Science Review, 27, 379–410. https://doi.org/10.1177/0160017604267628
- Richiardi, M, Poggi, A (2014). Imputing Individual Effects in Dynamic Microsimulation Models An application to household formation and labour market participation in Italy. International Journal of Microsimulation, 7, 3–39. https://doi.org/10.34196/ijm.00099
- Ryan, M, O’Donoghue, C (2017). In Farm-Level Microsimulation Modelling.
- Ryan, M, O’Donoghue, C (2019). Developing a microsimulation model for farm forestry planting decisions. International Journal of Microsimulation, 12, 18–36. https://doi.org/10.34196/ijm.00199
- Smith, A (2021). neworder: a dynamic microsimulation framework for Python. Journal of Open Source Software, 6. https://doi.org/10.21105/joss.03351
- Spielauer, M (2007). Dynamic microsimulation of health care demand, health care finance and the economic impact of health behaviours: Survey and review. International Journal of Microsimulation, 1, 35–53. https://doi.org/10.34196/ijm.00005
- Spielauer, M (2009). General characteristics of Modgen applications: exploring the model RiskPaths. Ottawa: Statistics Canada, Modeling Division. https://www.statcan.gc.ca/eng/microsimulation/modgen/new/chap3-eng.pdf.
- Spielauer, M, Horvath, GT, Fink, M, Abio, G, Souto, G, Patxot, C, Istenic, T (2020). microWELT: Microsimulation Projection of Indicators of the Economic Effects of Population Ageing Based on Disaggregated National Transfer Accounts (No.612). WIFO Working Papers.
- Spooner, F, Abrams, JF, Morrissey, K, Shaddick, G, Batty, M, Milton, R, Dennett, A, Lomax, N, Malleson, N, Nelissen, N, Coleman, A, Nur, J, Jin, Y, Greig, R, Shenton, C, Birkin, M (2021). A dynamic microsimulation model for epidemics. Social Science &Amp; Medicine, 291. https://doi.org/10.1016/j.socscimed.2021.114461
- Sutherland, H, Figari, F (2013). EUROMOD: the European Union tax-benefit microsimulation model. International Journal of Microsimulation, 6, 4–26. https://doi.org/10.34196/ijm.00075
- Zaidi, A, Rake, K (2001). Dynamic Microsimulation Models: A Review and Some Lessons for SAGE. Simulating Social Policy in an Ageing Society (SAGE) discussion paper, 2.
Article and author information
Author details
Acknowledgements
I am grateful to comments from conference participants at the IMA World Congress and the Ingrid2 workshop and to anonymous referee comments.
Publication history
Copyright
© 2025, Knight
This article is distributed under the terms of the Creative Commons Attribution License, which permits unrestricted use and redistribution provided that the original author and source are credited.